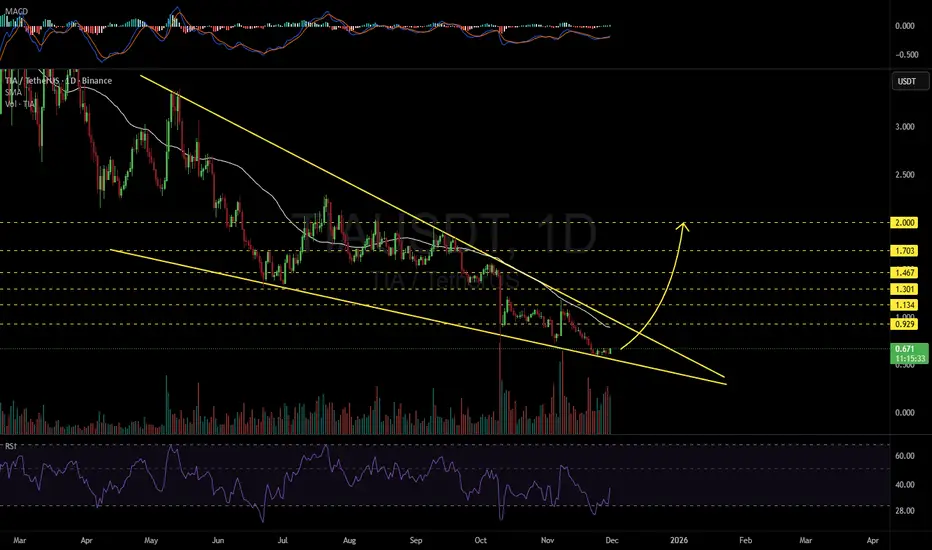
#TIA may be aiming for the $2 level.
#TIA is moving inside a falling wedge pattern on the daily chart and has bounced off the wedge support. In case of a breakout above the wedge resistance and the daily SMA50, the targets are:
🎯 $0.929
🎯 $1.134
🎯 $1.301
🎯 $1.467
🎯 $1.703
🎯 $2.000
⚠️ Always remember to use a tight stop-loss and maintain proper risk management.
免責事項
この情報および投稿は、TradingViewが提供または推奨する金融、投資、トレード、その他のアドバイスや推奨を意図するものではなく、それらを構成するものでもありません。詳細は利用規約をご覧ください。
免責事項
この情報および投稿は、TradingViewが提供または推奨する金融、投資、トレード、その他のアドバイスや推奨を意図するものではなく、それらを構成するものでもありません。詳細は利用規約をご覧ください。