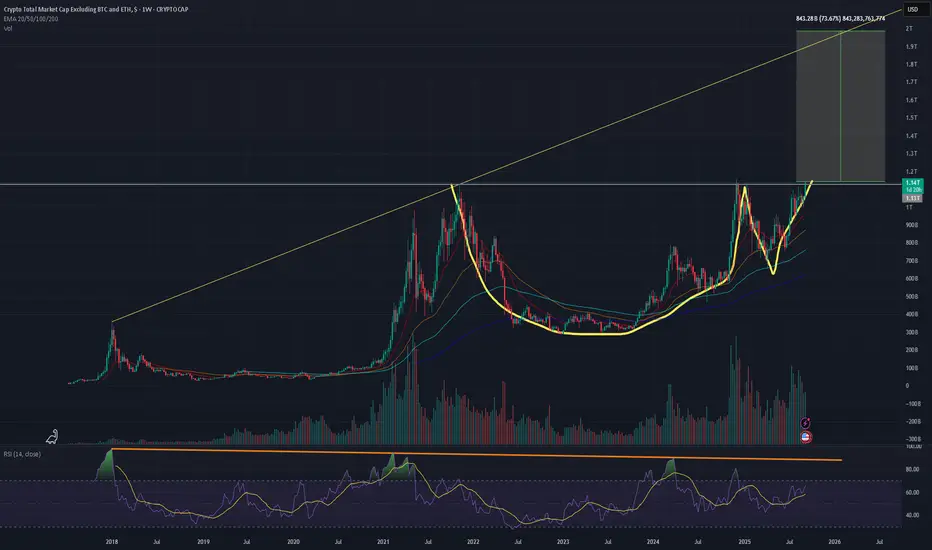
The total3 chart printed a high timeframe cup and handle formation and it looks like a breakout is imminent, but we could get some sideways action for a few weeks as well.
The measured move from this formation takes the market cap to $2 trillion, which looks like it will align with the ATH trendline, assuming the pump peaks in 3-6 months.
The BTC.D chart is breaking down as well which is a great sign.
My main concern is the USDT.D chart that's approaching strong support. Will that support stall alt season or stop it entirely? I think there's enough bullish signs to create the momentum that'll make this alt season take off.
Boost this post if you found it helpful.
免責事項
これらの情報および投稿は、TradingViewが提供または保証する金融、投資、取引、またはその他の種類のアドバイスや推奨を意図したものではなく、またそのようなものでもありません。詳しくは利用規約をご覧ください。
免責事項
これらの情報および投稿は、TradingViewが提供または保証する金融、投資、取引、またはその他の種類のアドバイスや推奨を意図したものではなく、またそのようなものでもありません。詳しくは利用規約をご覧ください。