TSLA Elliott Wave Update: B-Wave Truncation at 460 or Extension to 465?
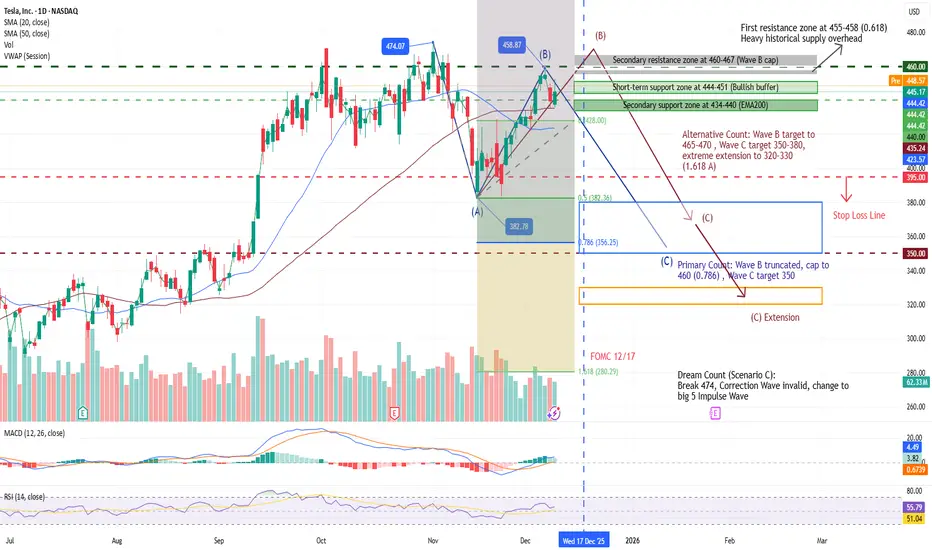
TSLA's rally from the 383 low has tested the 61.8% Fib at 458, forming a potential B-wave top in the A-B-C correction from the 474 high. EMAs provide dynamic support, but MACD/RSI mild divergence signals momentum fade.
Primary Count: B-wave truncates at 460 (0.786 Fib), capping the rally short; current pullback signals C-wave start, targeting 350 (1.0 extension of A). Volume below 1.5B shares on 455 test reinforces failure—odds of C to 350 rise to 70%. Short-term support at 444-451 (bull buffer).
- Resistance: Primary 455-458 (0.618 Fib + heavy historical supply); Secondary 460-467 (B cap, EMA50 crossover). Volume surge >1.5B needed for break.
- Support: Secondary 434-440 (EMA200 channel low).
- Indicators: MACD (12,26,9) red bars narrowing to 0.32 hints exhaustion; RSI (14) at 68 with bearish divergence warns pullback. Volume MA shows low conviction above 455 (1.3B vs. 1.5B threshold).
Alternative Count: B-wave extends to 465-470 (0.786-1.0 Fib), then C pulls back to 350-380 (1.0 extension) or 320-330 (1.618 A extreme). Probability 25-30%, up on recent strength.
Scenario C: B exceeds 474 on volume >1.5B, invalidating correction for 5-wave impulse: Wave 3 to 520 (1.618x Wave 1, Jan 2026); Wave 5 to 600+ (Q2 2026). Probability 30-35%.
Monitoring: 12/17 FOMC rate cut catalyst.
Disclaimer: This analysis is for educational purposes only and is not investment advice. Please do your own research (DYOR) before making any trading decisions.
“Discussion is welcome. Respect all views — markets are dynamic.”
免責事項
この情報および投稿は、TradingViewが提供または推奨する金融、投資、トレード、その他のアドバイスや推奨を意図するものではなく、それらを構成するものでもありません。詳細は利用規約をご覧ください。
“Discussion is welcome. Respect all views — markets are dynamic.”
免責事項
この情報および投稿は、TradingViewが提供または推奨する金融、投資、トレード、その他のアドバイスや推奨を意図するものではなく、それらを構成するものでもありません。詳細は利用規約をご覧ください。