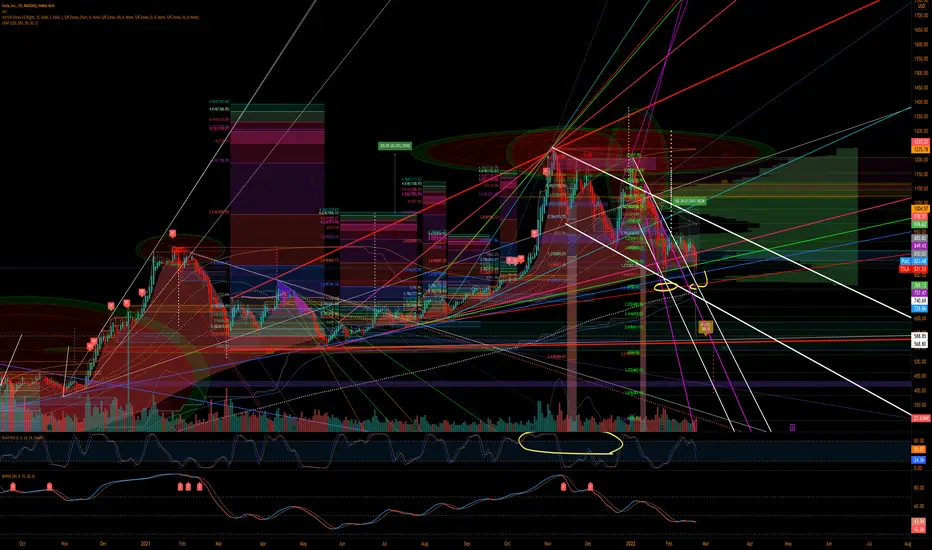
Hi, this is an update for one of my posts, after the earnings call the movements were negative and created a flag inside something that could be another flag.
All the patterns are encapsulated in a big pattern pointing to $390 USD, because the stock is close to oversold, i think is very possible to see upside movements and finish the flag pointing to $1,200 before to see the $393, at the end if this goes down first we will see the $1,200 then.
So ,at these levels i think it's much better start building a position.
免責事項
これらの情報および投稿は、TradingViewが提供または保証する金融、投資、取引、またはその他の種類のアドバイスや推奨を意図したものではなく、またそのようなものでもありません。詳しくは利用規約をご覧ください。
免責事項
これらの情報および投稿は、TradingViewが提供または保証する金融、投資、取引、またはその他の種類のアドバイスや推奨を意図したものではなく、またそのようなものでもありません。詳しくは利用規約をご覧ください。