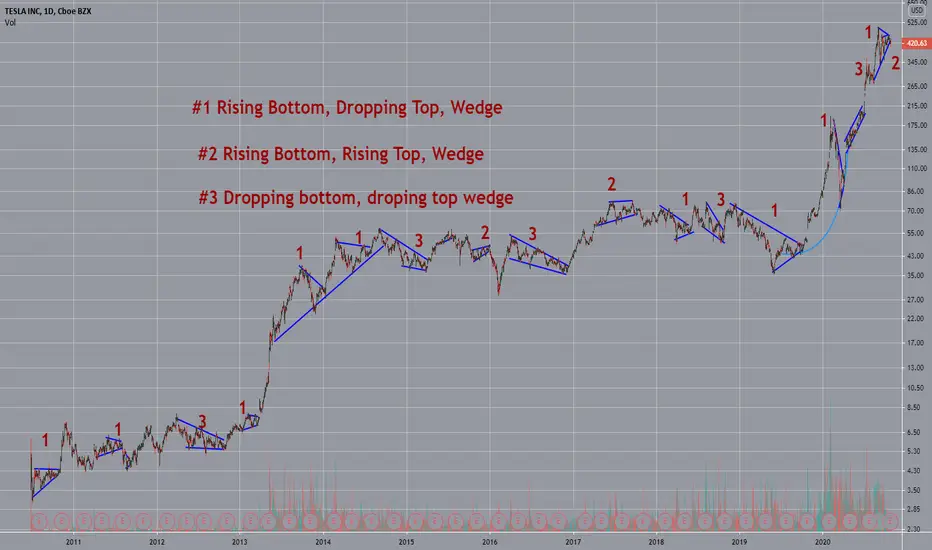
Three Wedge Patterns Identified; Wedge #1 Rising Bottom, Falling Top; Wedge #2 Rising Top, Rising Bottom; Wedge #3 Falling Top Falling Bottom
Wedge #1 Bull 8 Bear 1
Wedge #2 Bull 0 Bear 2
Wedge #3 Bull 5 Bear 0
Conclusion: For TSLA, historical patterns indicate Wedge 1 and 3 are correlated with Bull breaks; Wedge 2 does not have enough data, but trends bearish.
Wedge #1 Bull 8 Bear 1
Wedge #2 Bull 0 Bear 2
Wedge #3 Bull 5 Bear 0
Conclusion: For
免責事項
これらの情報および投稿は、TradingViewが提供または保証する金融、投資、取引、またはその他の種類のアドバイスや推奨を意図したものではなく、またそのようなものでもありません。詳しくは利用規約をご覧ください。
免責事項
これらの情報および投稿は、TradingViewが提供または保証する金融、投資、取引、またはその他の種類のアドバイスや推奨を意図したものではなく、またそのようなものでもありません。詳しくは利用規約をご覧ください。