Will Tesla break through the triangle consolidation standard?

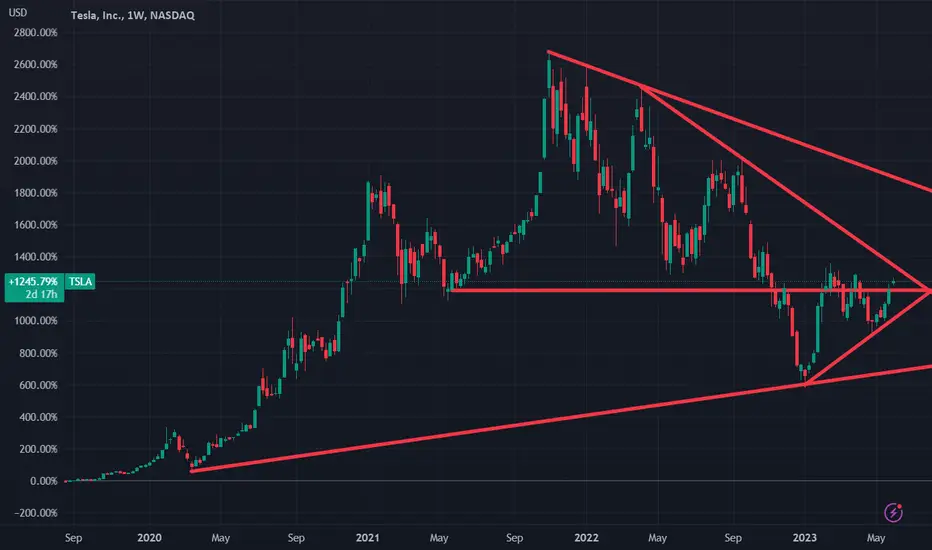
This chart shows the weekly candle chart of Tesla stock from the end of 2019 to the present. The graph overlays the line between the low point in April 2020 and the recent low point, the line between the high point in November 2021 and the recent high point, and the horizontal line of the bullish starting point in May 2021. As shown in the figure, from November 2022 to the present, Tesla's stock price has been in this critical position (193.87) and has engaged in more than three long short struggles, about to test the pressure line above! So in the future, Tesla's stock price is likely to fluctuate mainly in the triangle, waiting for the market to develop to the end of the triangle before choosing a new direction to break through!
This chart shows the weekly candle chart of Tesla stock from the end of 2019 to the present. The graph overlays the line between the low point in April 2020 and the recent low point, the line between the high point in November 2021 and the recent high point, and the horizontal line of the bullish starting point in May 2021. As shown in the figure, from November 2022 to the present, Tesla's stock price has been in this critical position (193.87) and has engaged in more than three long short struggles, about to test the pressure line above! So in the future, Tesla's stock price is likely to fluctuate mainly in the triangle, waiting for the market to develop to the end of the triangle before choosing a new direction to break through!
免責事項
これらの情報および投稿は、TradingViewが提供または保証する金融、投資、取引、またはその他の種類のアドバイスや推奨を意図したものではなく、またそのようなものでもありません。詳しくは利用規約をご覧ください。
免責事項
これらの情報および投稿は、TradingViewが提供または保証する金融、投資、取引、またはその他の種類のアドバイスや推奨を意図したものではなく、またそのようなものでもありません。詳しくは利用規約をご覧ください。