Breakdown (what the chart shows):
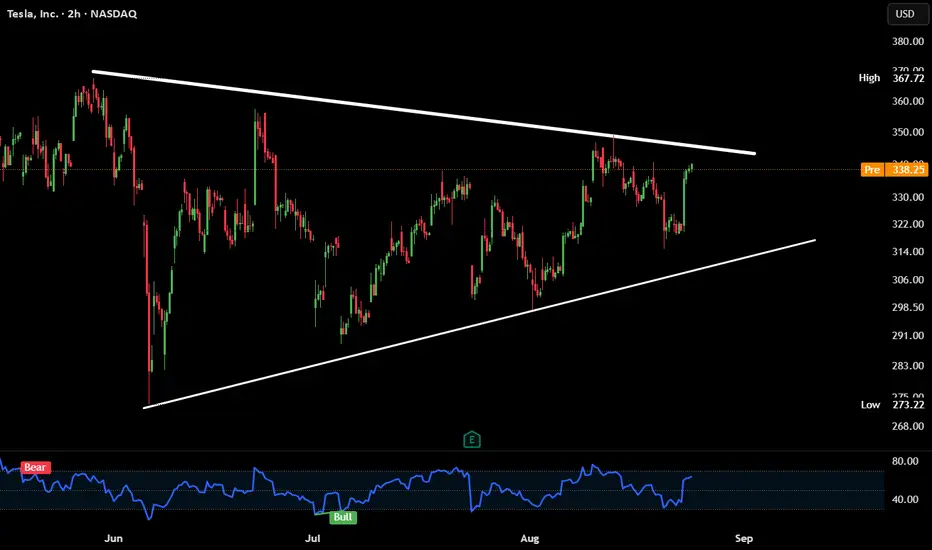
Tesla is forming a symmetrical triangle on the 2H chart. Price is squeezing between higher lows and lower highs.
Currently testing resistance near $338–340. Breakout or rejection incoming.
Confluence:
1. RSI bouncing back from near oversold → bullish momentum returning.
CTA :
Which way do you think it breaks — up or down?
Would you trade the breakout or fade the first move?
免責事項
この情報および投稿は、TradingViewが提供または推奨する金融、投資、トレード、その他のアドバイスや推奨を意図するものではなく、それらを構成するものでもありません。詳細は利用規約をご覧ください。
免責事項
この情報および投稿は、TradingViewが提供または推奨する金融、投資、トレード、その他のアドバイスや推奨を意図するものではなく、それらを構成するものでもありません。詳細は利用規約をご覧ください。