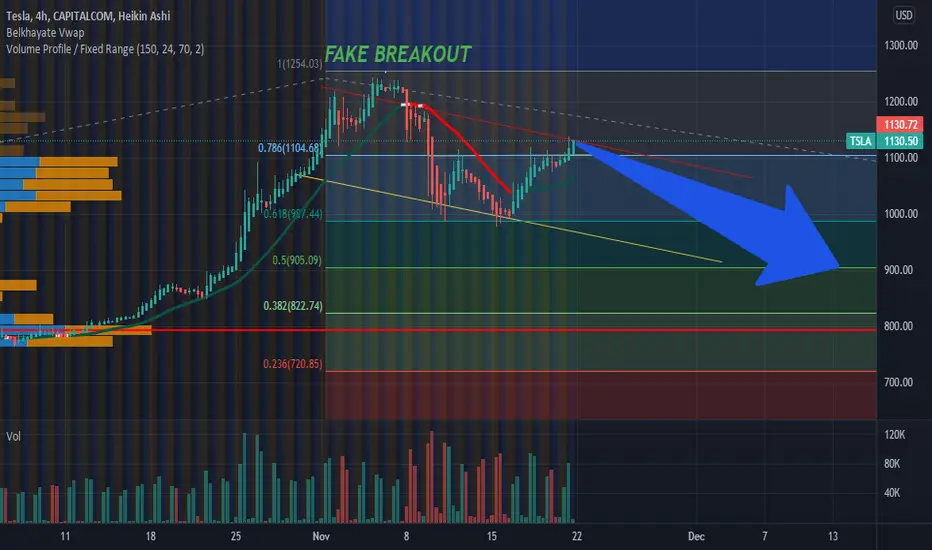
the price is touched the resistance and he will see a bearish trend to 900 and then he will see a bullish trend and breaking the resistance pattern when he complete elliott triple combo wave (wxyxz) . DISCLAIMER: This is not an financial advice (its my own opinion) Please only invest what you can afford to lose, and do your own research before investing.
トレード終了: 利益確定目標に到達
免責事項
この情報および投稿は、TradingViewが提供または推奨する金融、投資、トレード、その他のアドバイスや推奨を意図するものではなく、それらを構成するものでもありません。詳細は利用規約をご覧ください。
免責事項
この情報および投稿は、TradingViewが提供または推奨する金融、投資、トレード、その他のアドバイスや推奨を意図するものではなく、それらを構成するものでもありません。詳細は利用規約をご覧ください。