TSLA QuantSignals Katy 1M Prediction 2025-11-17
Symbol: TSLA
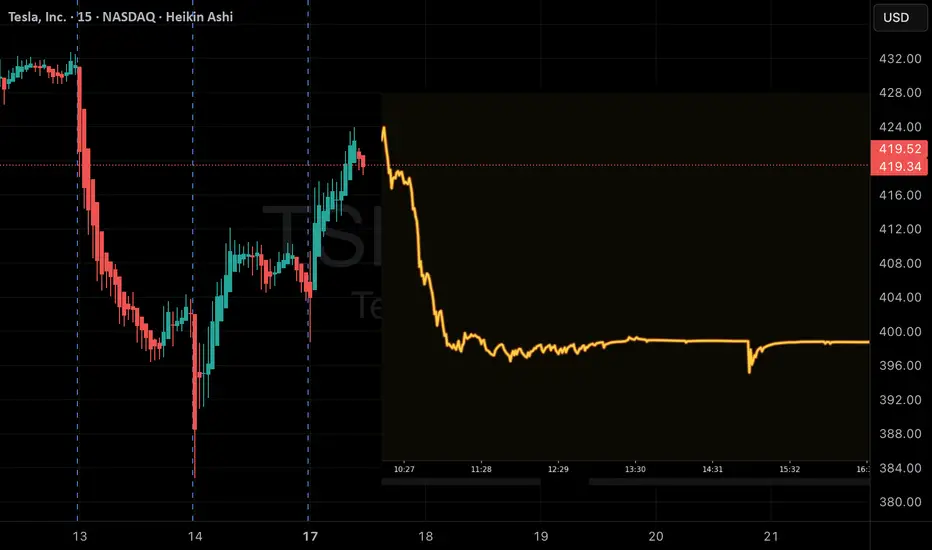
Price: 415.30
Model: Katy AI — 1M Prediction
Trend: Bearish
Confidence: 75%
🔮 Vision Summary
TSLA shows a bearish short-term structure, with the model forecasting a move toward 403.52
(-2.84%). Momentum is shifting lower, and volatility remains moderate at 20%, supporting a gradual downside drift rather than a sharp drop.
Near-term projection points to 411.47 within the next 30 minutes as price weakens into lower support zones.
📉 Key Levels
Entry Zone: 415.30
Downside Target: 405.87 – 403.52
Resistance / Invalidation: 421.53
🧭 Vision Bias
Bearish — Model anticipates sustained downside pressure as TSLA fails to reclaim short-term resistance.
Break above 421.53 invalidates the bearish thesis.
Symbol: TSLA
Price: 415.30
Model: Katy AI — 1M Prediction
Trend: Bearish
Confidence: 75%
🔮 Vision Summary
TSLA shows a bearish short-term structure, with the model forecasting a move toward 403.52
(-2.84%). Momentum is shifting lower, and volatility remains moderate at 20%, supporting a gradual downside drift rather than a sharp drop.
Near-term projection points to 411.47 within the next 30 minutes as price weakens into lower support zones.
📉 Key Levels
Entry Zone: 415.30
Downside Target: 405.87 – 403.52
Resistance / Invalidation: 421.53
🧭 Vision Bias
Bearish — Model anticipates sustained downside pressure as TSLA fails to reclaim short-term resistance.
Break above 421.53 invalidates the bearish thesis.
Free Signals Based on Latest AI models💰: QuantSignals.xyz
免責事項
この情報および投稿は、TradingViewが提供または推奨する金融、投資、トレード、その他のアドバイスや推奨を意図するものではなく、それらを構成するものでもありません。詳細は利用規約をご覧ください。
Free Signals Based on Latest AI models💰: QuantSignals.xyz
免責事項
この情報および投稿は、TradingViewが提供または推奨する金融、投資、トレード、その他のアドバイスや推奨を意図するものではなく、それらを構成するものでもありません。詳細は利用規約をご覧ください。