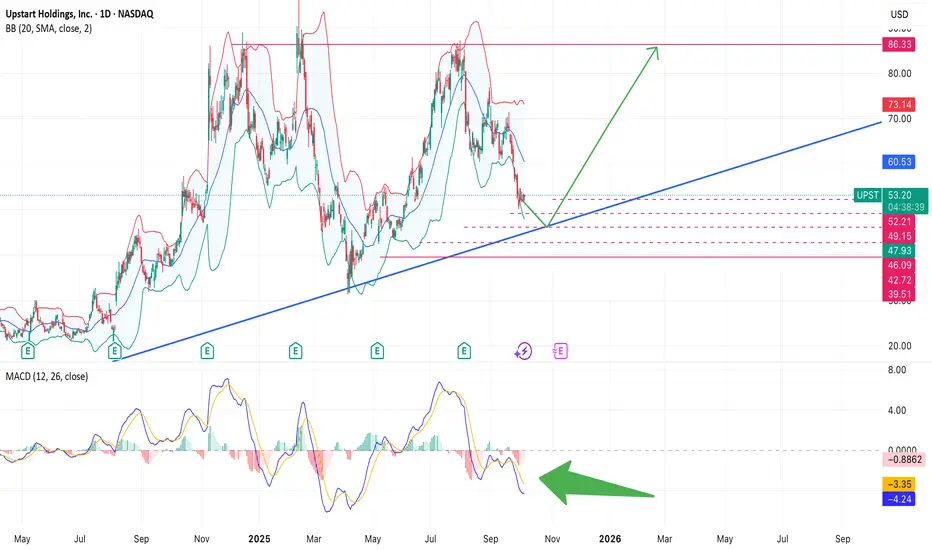
Upstart Holdings ( UPST) is once again testing its long-term ascending trendline
The price is hovering near a key support zone around $49–50, where buyers have stepped in before.
UPST Bullish scenario:
If support holds — a rebound toward $60 → $70 is possible, matching the mid-Bollinger band and prior resistance area.
Bearish scenario:
A breakdown below $49 could open the way to $46–42, where previous accumulation took place.
Technical setup:
The price is near the lower Bollinger Band, hinting at a potential reversal zone.
MACD is close to its historical lows:
Statistically, when MACD reached similar levels (in Dec 2024 and Mar 2025),
UPST rallied 30–50 % within the next 2–4 weeks.
The long-term trend remains upward since early 2024.
Bottom line:
UPST is at a decision point — if the pattern repeats, current levels could mark the start of a new bullish wave.
The price is hovering near a key support zone around $49–50, where buyers have stepped in before.
If support holds — a rebound toward $60 → $70 is possible, matching the mid-Bollinger band and prior resistance area.
Bearish scenario:
A breakdown below $49 could open the way to $46–42, where previous accumulation took place.
Technical setup:
The price is near the lower Bollinger Band, hinting at a potential reversal zone.
MACD is close to its historical lows:
Statistically, when MACD reached similar levels (in Dec 2024 and Mar 2025),
The long-term trend remains upward since early 2024.
Bottom line:
免責事項
この情報および投稿は、TradingViewが提供または推奨する金融、投資、トレード、その他のアドバイスや推奨を意図するものではなく、それらを構成するものでもありません。詳細は利用規約をご覧ください。
免責事項
この情報および投稿は、TradingViewが提供または推奨する金融、投資、トレード、その他のアドバイスや推奨を意図するものではなく、それらを構成するものでもありません。詳細は利用規約をご覧ください。