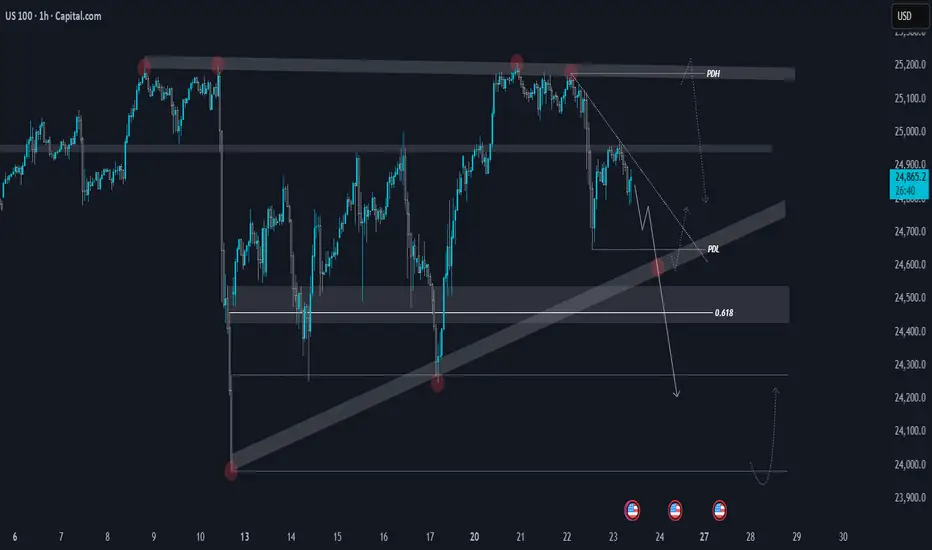
On the 4H timeframe, the index is approaching the trendline support around 24,600, which marks the third touch of this level. If this zone fails to hold, we could see an extended move toward the 24,000 area.
From a broader view, the daily chart shows a double top pattern along with a strong bearish divergence — both supporting a deeper pullback. However, a daily close above 25,220 would invalidate this view and could shift momentum back to the upside.
📰 With the ongoing U.S. government shutdown and heightened market uncertainty, sentiment remains mixed. Volatility is expected to stay elevated, so it’s best to wait for clear confirmation around key levels before taking any positions.
関連の投稿
免責事項
これらの情報および投稿は、TradingViewが提供または保証する金融、投資、取引、またはその他の種類のアドバイスや推奨を意図したものではなく、またそのようなものでもありません。詳しくは利用規約をご覧ください。
関連の投稿
免責事項
これらの情報および投稿は、TradingViewが提供または保証する金融、投資、取引、またはその他の種類のアドバイスや推奨を意図したものではなく、またそのようなものでもありません。詳しくは利用規約をご覧ください。