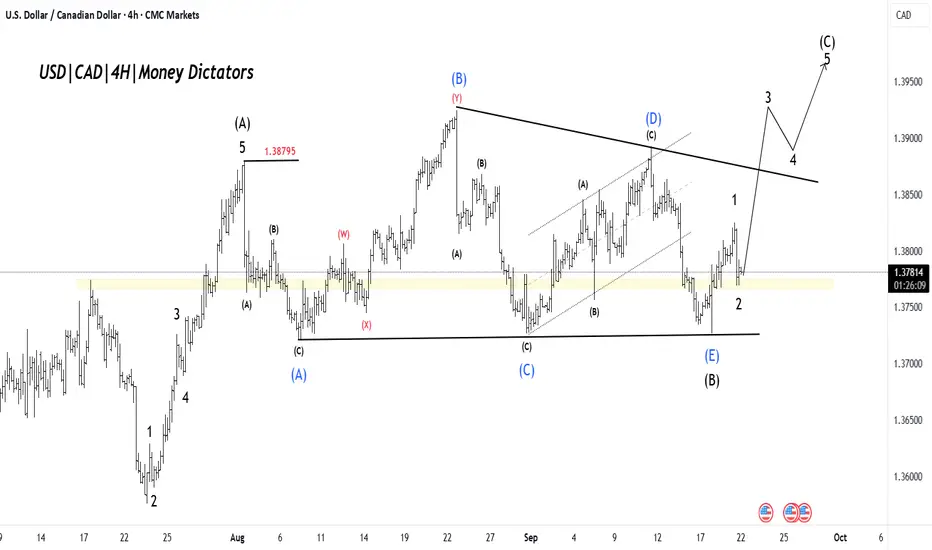
USD/CAD Price is showing the early stages of a bullish (C) leg after a large corrective sequence. The chart labels show a completed corrective (B) low at the horizontal support and an impulsive 1–2 sequence unfolding for the new upward leg. Bias: bullish while price holds above the demand zone/wave-2 low.
The market completed an ABC correction that found support on the horizontal lower boundary. That corrective phase looks finished; we should now be in wave (C) up, the final leg of the correction.
Short-term momentum has flipped, with buyers stepping in at support. This favors trend-following longs into the extension leg (wave 3 → 5)
Target 1 (T1): 1.38408
Target 2 (T2): 1.38810
Stop-Loss (SL): 1.37195
トレード終了: 利益確定目標に到達
Enjoy the profit!To eliminate these delays and give priority access to serious traders, we’ve launched an exclusive Premium EDU + Wave Count Group.
💰 Annual Fee: $115
BUY NOW: t.me/moneydictators/148
Lifetime Free - t.me/moneydictators
💰 Annual Fee: $115
BUY NOW: t.me/moneydictators/148
Lifetime Free - t.me/moneydictators
関連の投稿
免責事項
この情報および投稿は、TradingViewが提供または推奨する金融、投資、トレード、その他のアドバイスや推奨を意図するものではなく、それらを構成するものでもありません。詳細は利用規約をご覧ください。
To eliminate these delays and give priority access to serious traders, we’ve launched an exclusive Premium EDU + Wave Count Group.
💰 Annual Fee: $115
BUY NOW: t.me/moneydictators/148
Lifetime Free - t.me/moneydictators
💰 Annual Fee: $115
BUY NOW: t.me/moneydictators/148
Lifetime Free - t.me/moneydictators
関連の投稿
免責事項
この情報および投稿は、TradingViewが提供または推奨する金融、投資、トレード、その他のアドバイスや推奨を意図するものではなく、それらを構成するものでもありません。詳細は利用規約をご覧ください。