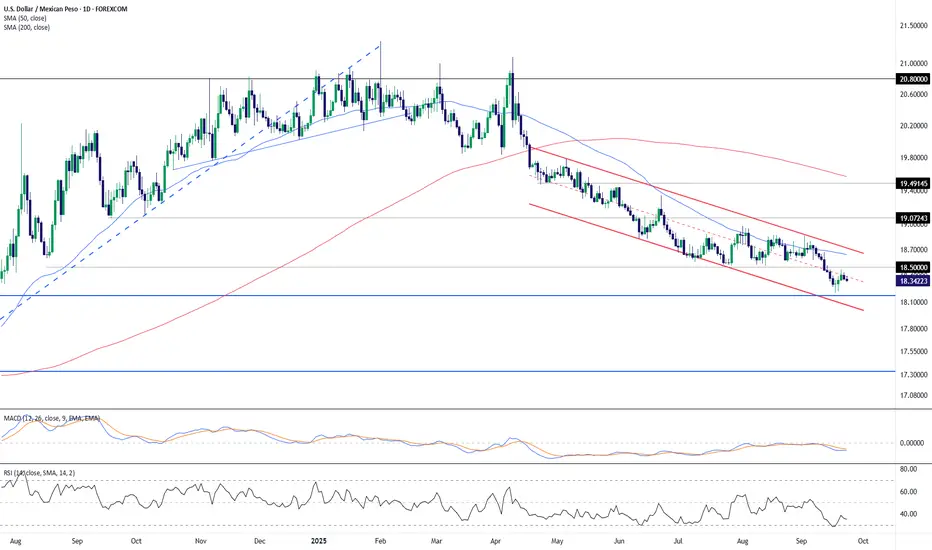
USD/MXN continues to trade inside a well-defined descending channel that has contained price action since mid-April. The pair recently bounced from the lower boundary of the channel near 18.20, but remains capped by resistance around the 50-day SMA (18.63). The broader structure remains bearish as the 200-day SMA (19.57) continues to slope lower above price.
Momentum indicators align with this view. The RSI is currently at 35, hovering near oversold territory but not yet signaling a clear reversal. The MACD remains in negative territory with the signal line above the MACD line, showing that bearish momentum is still intact despite the recent stabilization.
If the channel persists, traders may monitor the upper boundary near 19.00 as resistance, while the 18.20 region serves as immediate support. A break beyond either side of the channel could indicate a potential shift in trend strength.
-MW
免責事項
この情報および投稿は、TradingViewが提供または推奨する金融、投資、トレード、その他のアドバイスや推奨を意図するものではなく、それらを構成するものでもありません。詳細は利用規約をご覧ください。
免責事項
この情報および投稿は、TradingViewが提供または推奨する金融、投資、トレード、その他のアドバイスや推奨を意図するものではなく、それらを構成するものでもありません。詳細は利用規約をご覧ください。