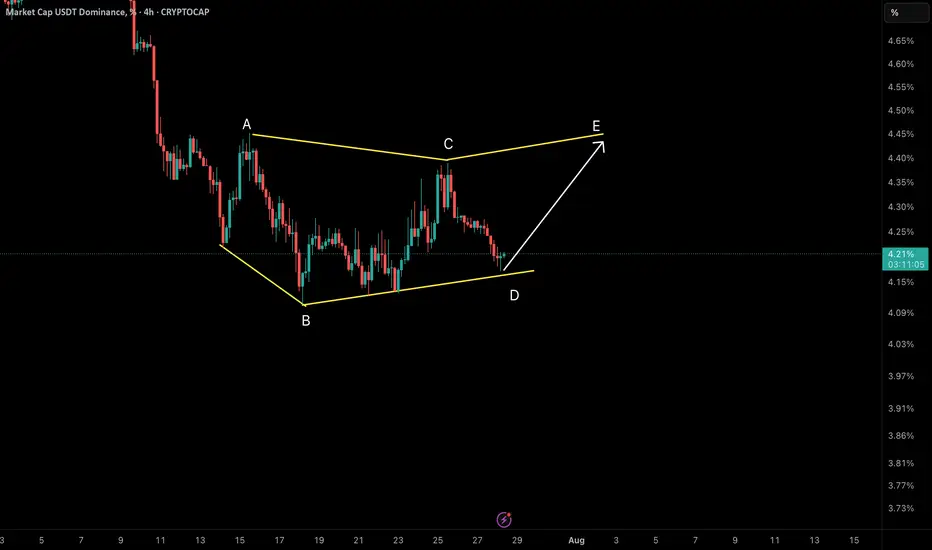
We are currently observing a Symmetrical Diametric correction pattern unfolding in the USDT Dominance chart. The wave structure labeled A–B–C–D–E shows clear evidence of this complex formation.
✅ Reasons for Diametric Labeling:
• Wave A and B initiated the pattern with a sharp drop (A), followed by wave B extending lower than A’s starting point – an early sign of a non-classical corrective structure.
• Waves C and D developed with alternating strength and duration, reflecting the expanding and contracting rhythm typical of diametric formations.
• Time and Price Alternation between segments is clearly visible, especially the extended duration between waves B and D compared to the earlier legs.
• The current price action is sitting right at the D wave bottom, which acts as a key structural support zone.
🔄 What’s Next?
• From this support, we expect wave E to initiate. In symmetrical diametrics, wave E typically reaches or slightly exceeds the top of wave C.
• A break below the D wave low doesn’t immediately invalidate the diametric scenario but may call for a re-evaluation toward an Expanded or Terminal Diametric.
• Confirmation of wave E may come with a bullish BOS (Break of Structure) on lower timeframes.
📌 Conclusion: We are likely at the early stage of wave E. If this interpretation holds, a bullish move should develop soon.
📡 Analysis by CryptoPilot – navigating the market with precision.
#CryptoPilot #USDT.D #Elliot #NeoWave #MarketStructure #TrendChannel #BOS #Altcoins #CryptoTrading
📊 CryptoPilot – Advanced Technical Analysis for BTC & Altcoins
🔎 Smart Money • Price Action • NeoWave • Multi-Timeframe Context
📩 Contact: @CryptoPilot_1 (Telegram)
📥 Telegram Chanell : @CryptoPilot_Trading
🔎 Smart Money • Price Action • NeoWave • Multi-Timeframe Context
📩 Contact: @CryptoPilot_1 (Telegram)
📥 Telegram Chanell : @CryptoPilot_Trading
免責事項
これらの情報および投稿は、TradingViewが提供または保証する金融、投資、取引、またはその他の種類のアドバイスや推奨を意図したものではなく、またそのようなものでもありません。詳しくは利用規約をご覧ください。