There has been a lot of demand for oil analysis.
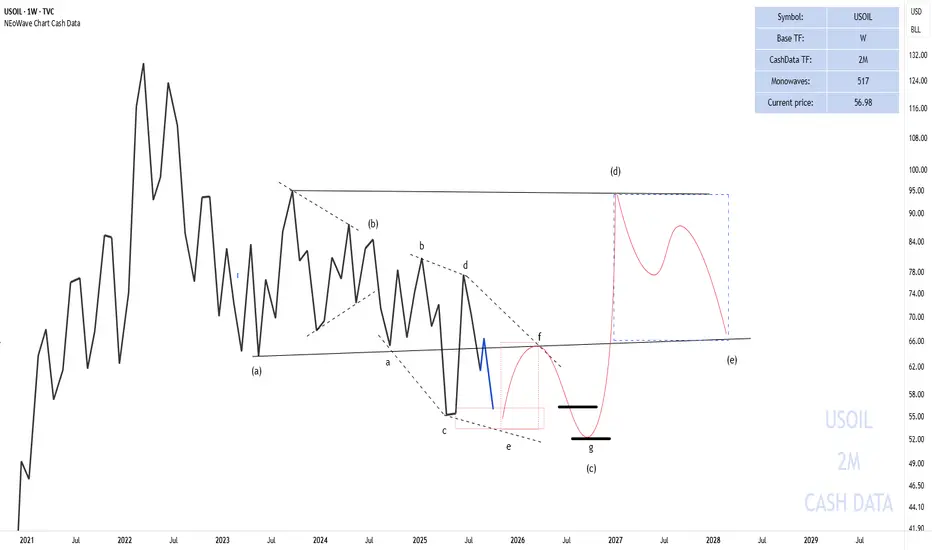
In the 2-month cash data, we see that oil reached $56, and many say there’s a possibility that oil may not touch the high levels above $70 again, but the chart suggests otherwise.
In the 2-month cash data, given the complexity in wave-(c), it appears that a reverse contracting triangle pattern is forming. After the completion of wave-(c), wave-(d) of this triangle could potentially rise to $90.
Currently, we are in wave-(c) of this triangle, which is transforming into a diamond diametric pattern. Wave g of this diametric could end at $56 or in the $50-52 range, completing wave-(c).
The chart will be updated if needed.
Good luck
NEoWave Chart
免責事項
これらの情報および投稿は、TradingViewが提供または保証する金融、投資、取引、またはその他の種類のアドバイスや推奨を意図したものではなく、またそのようなものでもありません。詳しくは利用規約をご覧ください。
免責事項
これらの情報および投稿は、TradingViewが提供または保証する金融、投資、取引、またはその他の種類のアドバイスや推奨を意図したものではなく、またそのようなものでもありません。詳しくは利用規約をご覧ください。