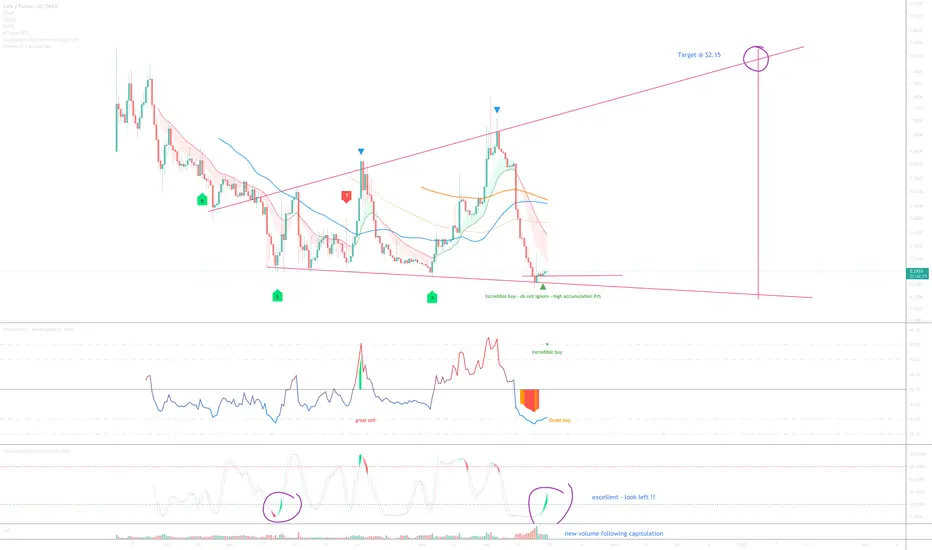
On the above 1-day chart price action has corrected near 80% since the beginning of September. Just heinous for those holding during that time. A ‘incredible buy’ signal now appears as Stochastic RSI is crossing up 20.
The situation is the same on the VELO/BTC chart with a 70% sell off to support following the ‘great sell’ alert (below).
Is it possible price action falls further? For sure.
Is it probable? 10%. In that a ‘incredible buy’ represents a 90% chance of upside.
A buy from 27 cents is amazing.
Target? To the upper side of channel 12-16 weeks from now @ $2.15
Good luck!
WW
1-day VELO / BTC chart
トレード稼働中
ノート
up 25% already, amazing. Expect resistance around 46 cents.ノート
Resistance came and went as expected. Price action now confirms support on past resistance, onward and upward from here.トレード稼働中
トレード稼働中
The Bullish divergence is very clear now. A significant move should now be expected.The divergence is also visible on the bitcoin chart with a number of oscillators diverging with price action.
トレード稼働中
You could wait all year for a signal like this... The 10-day VELO/BTC prints a massive Dragonfly DOJI candle.Latterly the dollar chart prints a 2nd 'incredible buy' signal. Should be a easy 2x in the near term.
トレード稼働中
Lots of oscillators printing bullish divergence with price action today. Look left.免責事項
これらの情報および投稿は、TradingViewが提供または保証する金融、投資、取引、またはその他の種類のアドバイスや推奨を意図したものではなく、またそのようなものでもありません。詳しくは利用規約をご覧ください。
免責事項
これらの情報および投稿は、TradingViewが提供または保証する金融、投資、取引、またはその他の種類のアドバイスや推奨を意図したものではなく、またそのようなものでもありません。詳しくは利用規約をご覧ください。