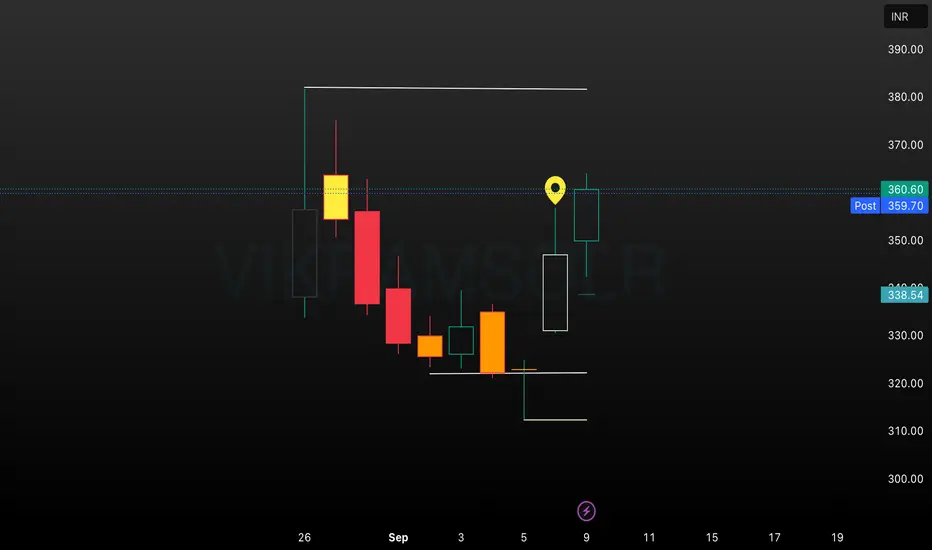
The VIKRAMSOLR daily chart illustrates a sustained recovery and momentum build-up after a series of bearish sessions. Price action rebounded from the recent low near ₹310–₹320, breaking past intermediate resistances with expanding volume and energized candlestick formation. The highlighted region signals renewed bullish participation and possible extension towards the next resistance
免責事項
この情報および投稿は、TradingViewが提供または推奨する金融、投資、トレード、その他のアドバイスや推奨を意図するものではなく、それらを構成するものでもありません。詳細は利用規約をご覧ください。
免責事項
この情報および投稿は、TradingViewが提供または推奨する金融、投資、トレード、その他のアドバイスや推奨を意図するものではなく、それらを構成するものでもありません。詳細は利用規約をご覧ください。