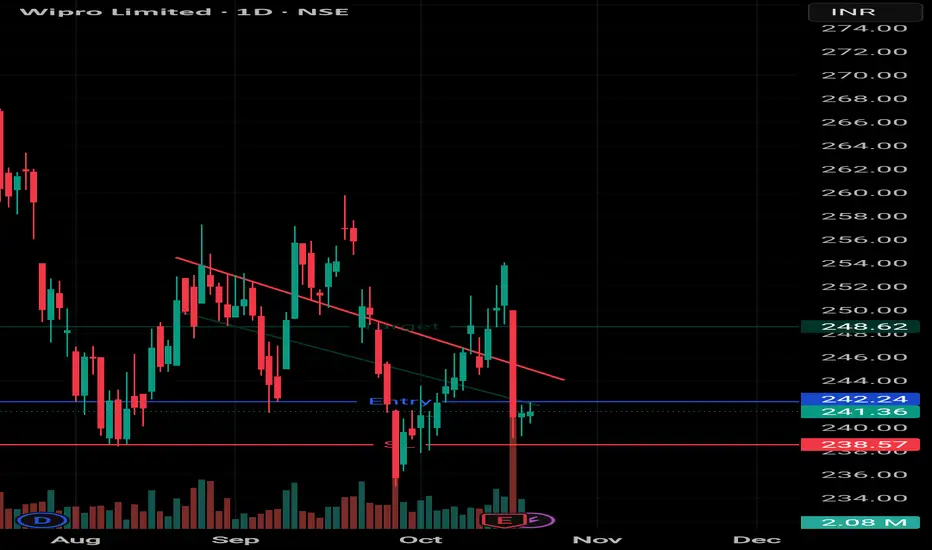
The latest price chart highlights a Falling Wedge pattern, a classic bullish formation that often signals the downtrend is losing strength and a breakout to the upside could be near. The stock has been consolidating within the wedge, and a breakout above the resistance line could confirm a strong upward move.
免責事項
これらの情報および投稿は、TradingViewが提供または保証する金融、投資、取引、またはその他の種類のアドバイスや推奨を意図したものではなく、またそのようなものでもありません。詳しくは利用規約をご覧ください。
免責事項
これらの情報および投稿は、TradingViewが提供または保証する金融、投資、取引、またはその他の種類のアドバイスや推奨を意図したものではなく、またそのようなものでもありません。詳しくは利用規約をご覧ください。