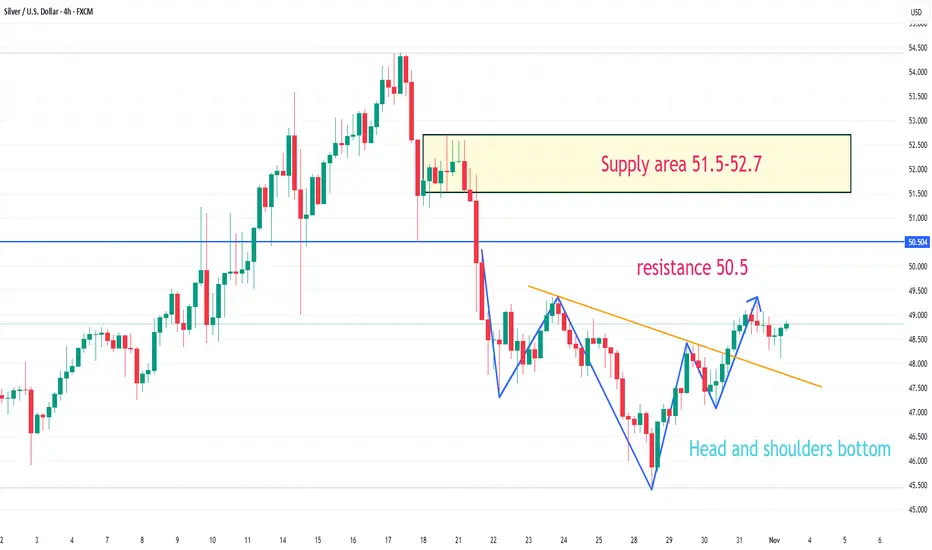
On the 4-hour chart, XAGUSD has formed a head and shoulders bottom pattern. Currently, watch for resistance around 49.4; a break above this level could lead to further upward movement, with resistance around 50.5, and further upside potential in the 51.5-52.7 area after that.
免責事項
これらの情報および投稿は、TradingViewが提供または保証する金融、投資、取引、またはその他の種類のアドバイスや推奨を意図したものではなく、またそのようなものでもありません。詳しくは利用規約をご覧ください。
免責事項
これらの情報および投稿は、TradingViewが提供または保証する金融、投資、取引、またはその他の種類のアドバイスや推奨を意図したものではなく、またそのようなものでもありません。詳しくは利用規約をご覧ください。