Another good week last week wit over 600 pips profit from the buy and sell levels.
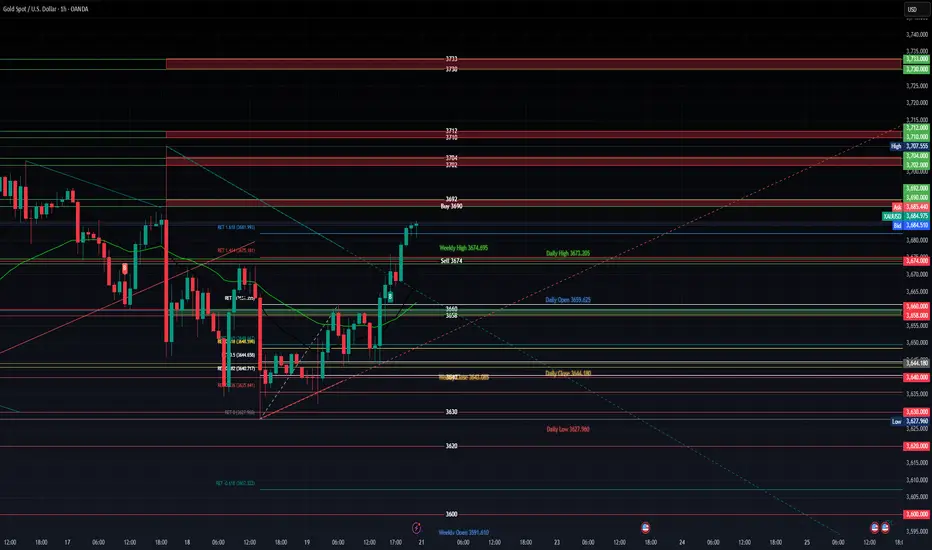
This week am looking to take buy at 3690, and a break of 3692 should contimue upwards until the next resistance at 3672/74 area.
personally i think we are due a correction its just a matter of how high can we go before that happens.
Follow the levals upwards noteing resistances at key levels.
On the sell side ill look at entering at 3674 , a break of 3672/70 would signal a further downward trend,
key levels to watch at 3660/58 which will be strong support.
Ill update this chart as the week progresses .
Until then trade safe use approprate lots sizes and proper risk.
トレード稼働中
Buy running 385 pipsトレード終了: 利益確定目標に到達
587 pips on the buy another great start to the week
関連の投稿
免責事項
これらの情報および投稿は、TradingViewが提供または保証する金融、投資、取引、またはその他の種類のアドバイスや推奨を意図したものではなく、またそのようなものでもありません。詳しくは利用規約をご覧ください。
関連の投稿
免責事項
これらの情報および投稿は、TradingViewが提供または保証する金融、投資、取引、またはその他の種類のアドバイスや推奨を意図したものではなく、またそのようなものでもありません。詳しくは利用規約をご覧ください。