XLM/USDT — Daily Chart Analysis
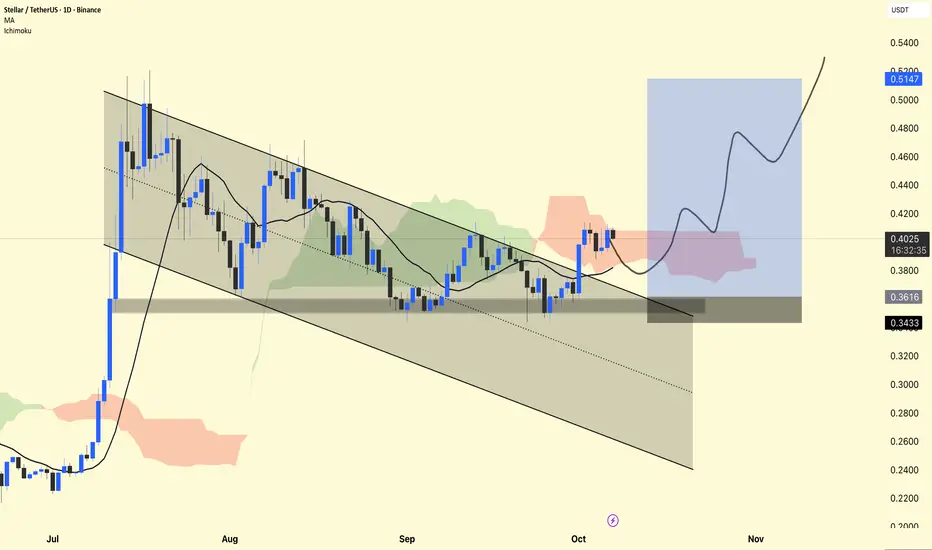
The price is currently trading around $0.40, holding firmly above the demand zone ($0.36–$0.34).
The chart shows a falling channel breakout, which is a bullish reversal pattern.
The Ichimoku Cloud is showing early signs of a bullish trend as the price is attempting to hold above the cloud base.
The moving average (MA) at $0.38 is acting as dynamic support – a positive sign for further upside.
📈 Long Setup:
Entry Zone: $0.38–$0.40
Stop-Loss: Below $0.34 (clear invalidation level)
Targets:
🎯 $0.46 → First Target
🎯 $0.51 → Main Swing Target
DYOR | NFA
関連の投稿
免責事項
この情報および投稿は、TradingViewが提供または推奨する金融、投資、トレード、その他のアドバイスや推奨を意図するものではなく、それらを構成するものでもありません。詳細は利用規約をご覧ください。
関連の投稿
免責事項
この情報および投稿は、TradingViewが提供または推奨する金融、投資、トレード、その他のアドバイスや推奨を意図するものではなく、それらを構成するものでもありません。詳細は利用規約をご覧ください。