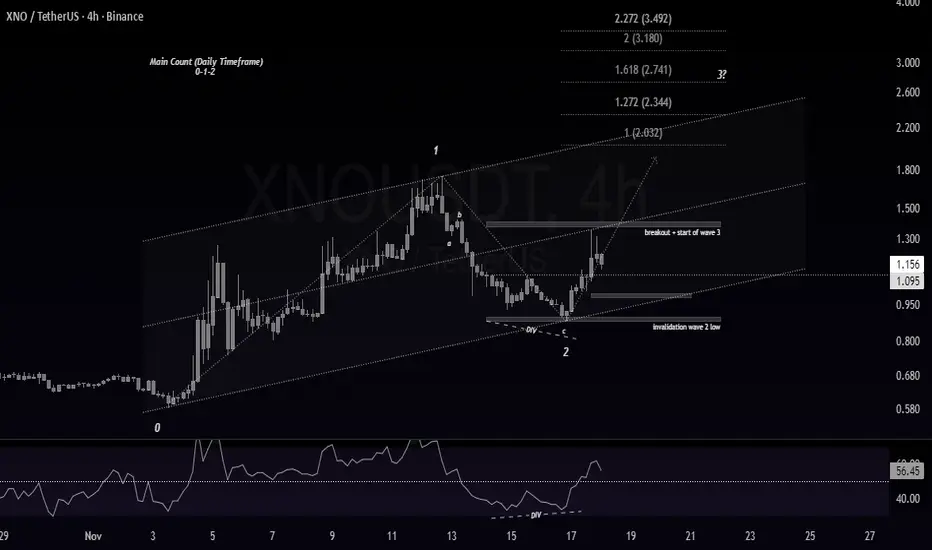
XNO is forming a clean Elliott Wave structure at the moment.
The main wave count is taken from the daily timeframe, where Wave 1 and Wave 2 are already established.
On the 4H chart, Wave 2 ended with a clear bullish RSI divergence, and price respected the support zone perfectly.
The break above the internal “b-wave” high confirms the early development of Wave 3.
As long as price holds above the Wave-2 low, the bullish setup remains valid.
I’ll update Wave 3 targets as Wave i unfolds and provides clearer levels.
This is a personal wave count, not financial advice.
DhArI
免責事項
この情報および投稿は、TradingViewが提供または推奨する金融、投資、トレード、その他のアドバイスや推奨を意図するものではなく、それらを構成するものでもありません。詳細は利用規約をご覧ください。
DhArI
免責事項
この情報および投稿は、TradingViewが提供または推奨する金融、投資、トレード、その他のアドバイスや推奨を意図するものではなく、それらを構成するものでもありません。詳細は利用規約をご覧ください。