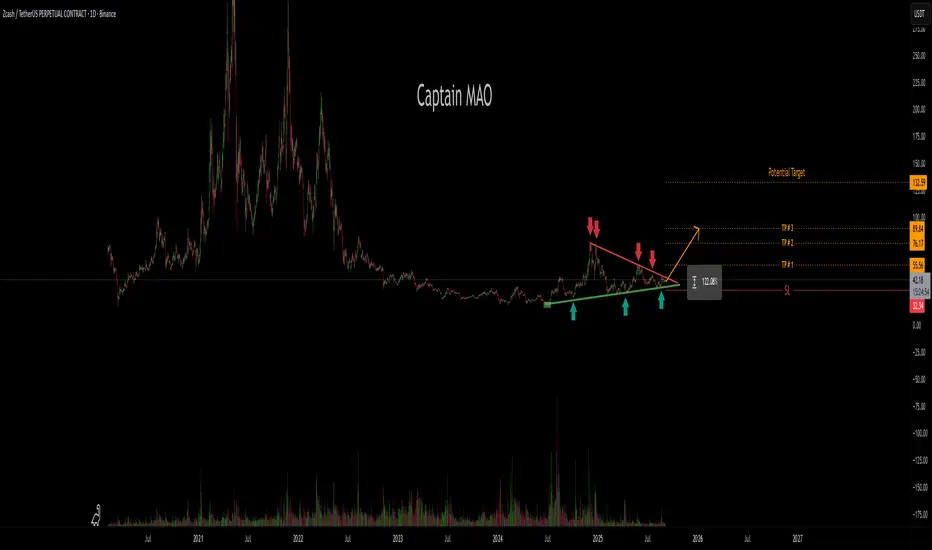
For the past 9+ months, ZEC/USDT has been in a prolonged correction and consolidation phase, forming a huge symmetrical triangle pattern. This structure reflects a balance between buyers and sellers, with volatility compressing as price coils tighter toward the apex of the triangle.
Price action is now approaching a decisive point. According to the 5th-touch breakout rule, the 5th attempt to test trendline support or resistance often results in a make-or-break breakout.
If buyers seize control, a confirmed breakout above the triangle could trigger a powerful expansion move. Conversely, failure to hold the apex level could result in a downside continuation.
ノート
111% so far TP1&TP#2 hiノート
TP#3 132% トレード終了: 利益確定目標に到達
Boom 248% all take profit price hit time to rest 🧠 8+ yrs in crypto & Forex | ⚡ Scalp & swing trader | 📊 Price action lover | 🎯 Hunting setups daily ✅
免責事項
この情報および投稿は、TradingViewが提供または推奨する金融、投資、トレード、その他のアドバイスや推奨を意図するものではなく、それらを構成するものでもありません。詳細は利用規約をご覧ください。
🧠 8+ yrs in crypto & Forex | ⚡ Scalp & swing trader | 📊 Price action lover | 🎯 Hunting setups daily ✅
免責事項
この情報および投稿は、TradingViewが提供または推奨する金融、投資、トレード、その他のアドバイスや推奨を意図するものではなく、それらを構成するものでもありません。詳細は利用規約をご覧ください。