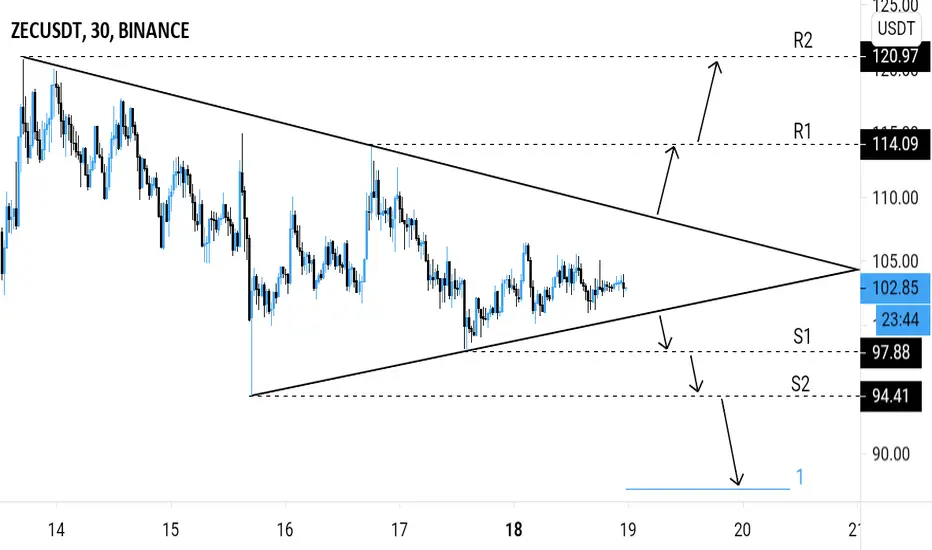
Analysis 🔎: ZENUSDT is consolidating in a symmetrical triangle pattern.
Breakout is imminent.
Bullish ⬆️: breakout above the symmetrical triangle's inclined resistance.
Bearish ⬇️: breakdown below the symmetrical triangle's inclined support.
Possible breakout price actions are indicated by the arrows on the chart.
Targets 🎯: Bullish ⬆️ - horizontal resistance levels (R1, R2).
Bearish ⬇️ - horizontal support levels (S1, S2), fibonacci extension levels.
免責事項
これらの情報および投稿は、TradingViewが提供または保証する金融、投資、取引、またはその他の種類のアドバイスや推奨を意図したものではなく、またそのようなものでもありません。詳しくは利用規約をご覧ください。
免責事項
これらの情報および投稿は、TradingViewが提供または保証する金融、投資、取引、またはその他の種類のアドバイスや推奨を意図したものではなく、またそのようなものでもありません。詳しくは利用規約をご覧ください。