INVITE-ONLY SCRIPT
MTF Deviation - Mtrl_Scientist
アップデート済
Hi everyone,
There are a lot of possible ways to look at markets and find valid patterns.
This time, I've looked at how shorter time frames deviate from the overall price consensus.
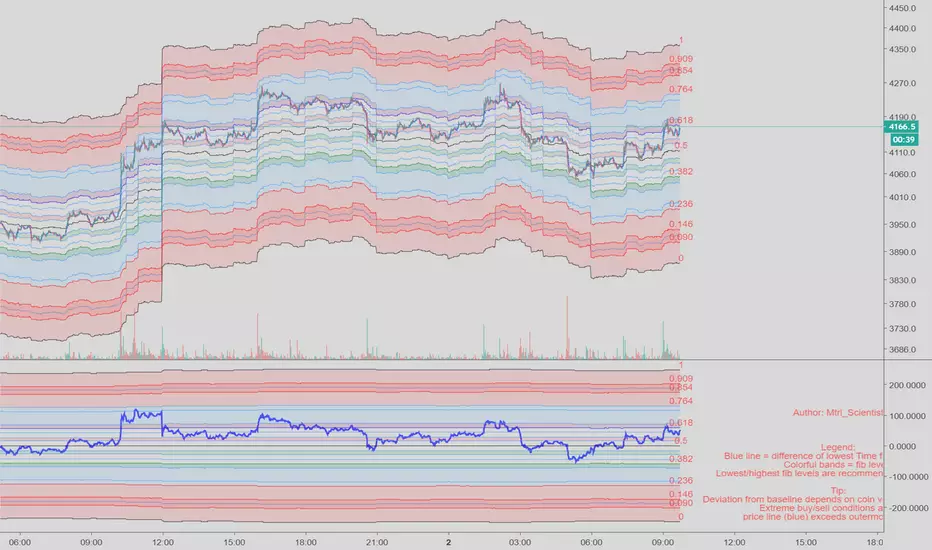
What you're seeing here is a range-bound difference of the lowest time frame from the overall price consensus (baseline), represented as blue line.
When lower time frames agree with the baseline, the difference becomes 0.
Logically, this difference cannot deviate too much from the baseline, and to quantify that, I've added fib-levels based on a deviation percentage that depends on price volatility and can be adjusted in the settings.

How it works:
First of all, you need to switch to the 1min time frame to get access to the lowest time frame data.
Look at how the blue line follows the support/resistance fib levels.
Oversold conditions are usually given by entering the lowest red band, whereas overbought conditions are given by entering the upper red band.
However, there are also extreme cases, where the blue line exceeds the set fib levels. In that case, price will reverse with very high likelihood.
Alternatively you can also ping-pong between two fib levels for frequent small trades.
Note that this indicator doesn't use any security functions to access time frame data. Instead, I found a different way to avoid repainting.
At the moment I'm just playing around with this to see how I can improve it. Feedback is very welcome!
There are a lot of possible ways to look at markets and find valid patterns.
This time, I've looked at how shorter time frames deviate from the overall price consensus.
What you're seeing here is a range-bound difference of the lowest time frame from the overall price consensus (baseline), represented as blue line.
When lower time frames agree with the baseline, the difference becomes 0.
Logically, this difference cannot deviate too much from the baseline, and to quantify that, I've added fib-levels based on a deviation percentage that depends on price volatility and can be adjusted in the settings.
How it works:
First of all, you need to switch to the 1min time frame to get access to the lowest time frame data.
Look at how the blue line follows the support/resistance fib levels.
Oversold conditions are usually given by entering the lowest red band, whereas overbought conditions are given by entering the upper red band.
However, there are also extreme cases, where the blue line exceeds the set fib levels. In that case, price will reverse with very high likelihood.
Alternatively you can also ping-pong between two fib levels for frequent small trades.
Note that this indicator doesn't use any security functions to access time frame data. Instead, I found a different way to avoid repainting.
At the moment I'm just playing around with this to see how I can improve it. Feedback is very welcome!
リリースノート
Updated color scheme and added new fib levels.Material Indicators
招待専用スクリプト
このスクリプトへのアクセスは作者が許可したユーザーに制限されており、通常はお支払いが必要です。お気に入りに追加することはできますが、許可を申請して作者が許可した後でなければ使用することはできません。 詳細については Mtrl_Scientist にお問い合わせいただくか、以下の作者の指示に従ってください。
このスクリプトは、スクリプトのモデレーターによって分析が行われていないプライベートな招待専用スクリプトであることにご注意ください。ハウスルールに準拠しているかは不明です。TradingViewは、スクリプトの作者を100%%信頼して、スクリプトの動作を理解しているといった場合でない限りは、代金を支払ってまで利用するのはお勧めしません。コミュニティスクリプトで、その代わりとなるオープンソースの優れたスクリプトが無料で見つかるケースも多くあります。
チャートでこのスクリプトを利用したいですか?
注: アクセス権をリクエストされる前にこちらをご覧ください。
免責事項
これらの情報および投稿は、TradingViewが提供または保証する金融、投資、取引、またはその他の種類のアドバイスや推奨を意図したものではなく、またそのようなものでもありません。詳しくは利用規約をご覧ください。