INVITE-ONLY SCRIPT
[KRONOS] Momentum

Description
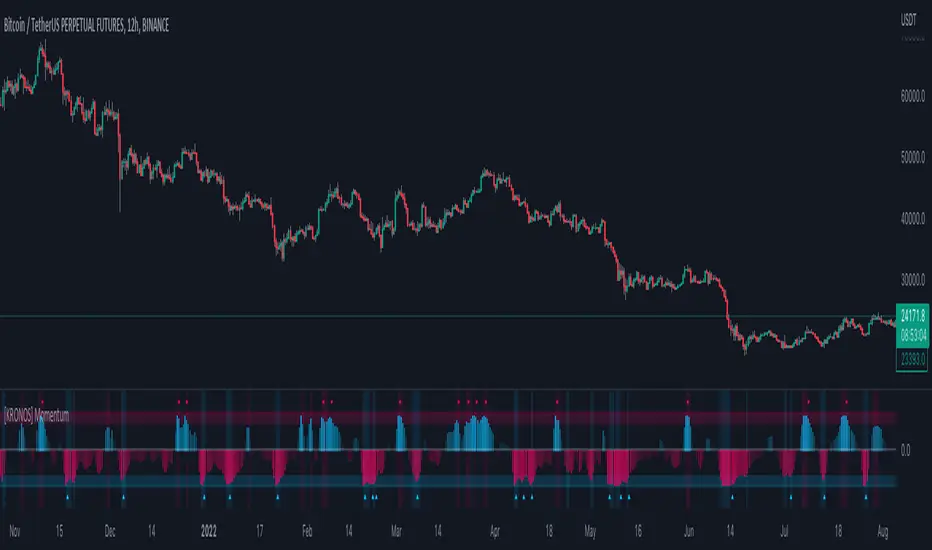
This indicator is based on an algorithm which provides accurate momentum tracking on every timeframe. It is visualized as a colored histogram and through some other tools.
The value is calculated from an exponentially weighted moving average that is used to get a high and a low deviation, merging the last value into a range.
It includes
Overbought and oversold fixed areas. Their purpose is to facilitate the recognition of areas where the trend is likely to end or cool down. They are also marked with a background coloring.
Zero line. It typically represents a change of trend when the price crosses under or over it.
Volume shifts. Colored arrows will appear whenever a volume change is detected.
How to use?
Buy/Long on a blue confirmation arrow
Sell/Short on a red confirmation arrow
Take profit when the indicator starts showing a blue background
Take profit when the indicator starts showing a red background
extra tip: the zero line often acts as support / resistance similarly to the overbought and oversold areas
招待専用スクリプト
このスクリプトへのアクセスは作者が許可したユーザーに制限されており、通常はお支払いが必要です。お気に入りに追加することはできますが、許可を申請して作者が許可した後でなければ使用することはできません。 詳細については kronos-algo にお問い合わせいただくか、以下の作者の指示に従ってください。
スクリプトの動作を理解していて作者も100%信頼できるということでなければ、TradingViewとしてはお金を払ってまでスクリプトを利用するのはお勧めしません。そのかわりに、コミュニティスクリプトでオープンソースの優れたスクリプトが無料で見つけられることが多々あります。
作者の指示
″Learn more at: https://kronos-trading.com/indicators
Our indicators are suitable for all markets: Crypto, Forex, stocks, etc.
チャートでこのスクリプトを利用したいですか?
注: アクセス権をリクエストされる前にこちらをご覧ください。
Learn more at: kronos-trading.com/indicators
Our indicators are suitable for all markets: Crypto, Forex, stocks, etc.
Our indicators are suitable for all markets: Crypto, Forex, stocks, etc.
免責事項
これらの情報および投稿は、TradingViewが提供または保証する金融、投資、取引、またはその他の種類のアドバイスや推奨を意図したものではなく、またそのようなものでもありません。詳しくは利用規約をご覧ください。