INVITE-ONLY SCRIPT
Bull Bear Trend Anlysis Signals by ActualEquation
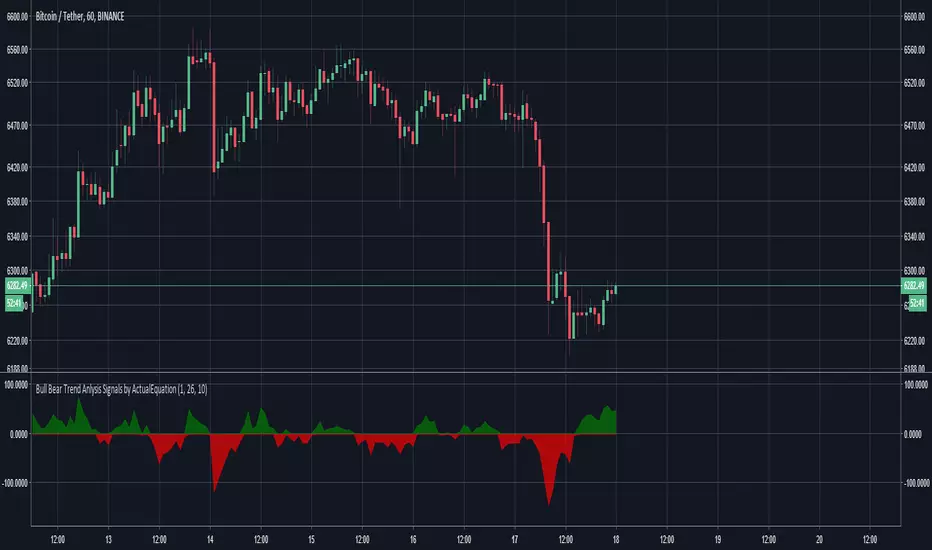
This indicator analyzes the trend utilizing MACD and other math algorithms to find confirmed entries and exits.
How To Use
Best used on TF larger than 1 hour for highest accuracy.
The higher the wave the stronger the trend.
For entries, wait for the wave to rise then enter after a color flip.
Once flipped, you can look for entries at a smaller time frame to narrow down your buy price.
For shorts, wait for confirmation of color flip with initial red wave down.
BOUNCE PLAYS:
1. Find Divergences via the height of the wave.
2. The more stretched from 0 the stronger the strength.
3. If second drop/rise is less than first, then divergence is present, look for entry.
4. Zoom in to the hourly charts to find initial bounces, then zoom into 5 minutes to look for setups.
NOTE: all signals strength are based off the charts macro strength and most are delayed. If the signal is too high, then it should be the time to close position soon.
招待専用スクリプト
このスクリプトは作者が承認したユーザーのみアクセス可能です。使用するにはアクセス申請をして許可を得る必要があります。通常は支払い後に承認されます。詳細は下記の作者の指示に従うか、ChaiQixuanに直接お問い合わせください。
TradingViewは、作者を完全に信頼し、スクリプトの動作を理解していない限り、有料スクリプトの購入・使用を推奨しません。コミュニティスクリプトには無料のオープンソースの代替が多数あります。
作者の指示
免責事項
この情報および投稿は、TradingViewが提供または推奨する金融、投資、トレード、その他のアドバイスや推奨を意図するものではなく、それらを構成するものでもありません。詳細は利用規約をご覧ください。