INVITE-ONLY SCRIPT
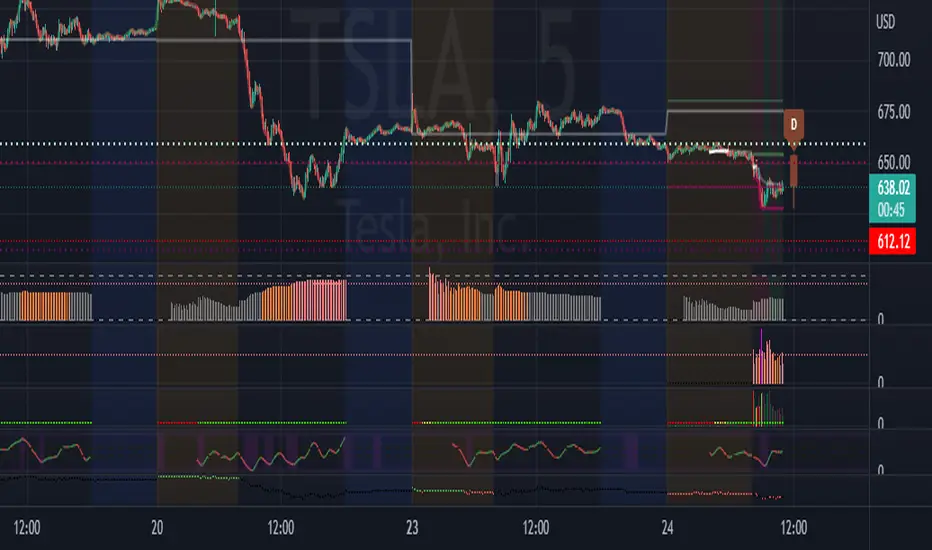
Specific Bar Volume Ratio
アップデート済
Simple.
NYSE only.
0930am-1130am only.
The colors are based on the popular Zanger Ratio.
The code compares the current volume (5m candles) to the average of precisely the same candle on the same day over the past 20 trading days.
Below 60 = drying up / low (grey)
Above 60 = below average (orange)
Above 80 = average (pink)
Above 120 = High (magenta)
Above 200 = Extreme (red)
The example you see is in Central time.
Contact me if you are interested.
リリースノート
Cleaned up code.招待専用スクリプト
このスクリプトへのアクセスは作者が許可したユーザーに制限されており、通常はお支払いが必要です。お気に入りに追加することはできますが、許可を申請して作者が許可した後でなければ使用することはできません。 詳細については kmack282 にお問い合わせいただくか、以下の作者の指示に従ってください。
スクリプトの動作を理解していて作者も100%信頼できるということでなければ、TradingViewとしてはお金を払ってまでスクリプトを利用するのはお勧めしません。そのかわりに、コミュニティスクリプトでオープンソースの優れたスクリプトが無料で見つけられることが多々あります。
チャートでこのスクリプトを利用したいですか?
注: アクセス権をリクエストされる前にこちらをご覧ください。
免責事項
これらの情報および投稿は、TradingViewが提供または保証する金融、投資、取引、またはその他の種類のアドバイスや推奨を意図したものではなく、またそのようなものでもありません。詳しくは利用規約をご覧ください。