OPEN-SOURCE SCRIPT
ADX & DI trend exhaustion
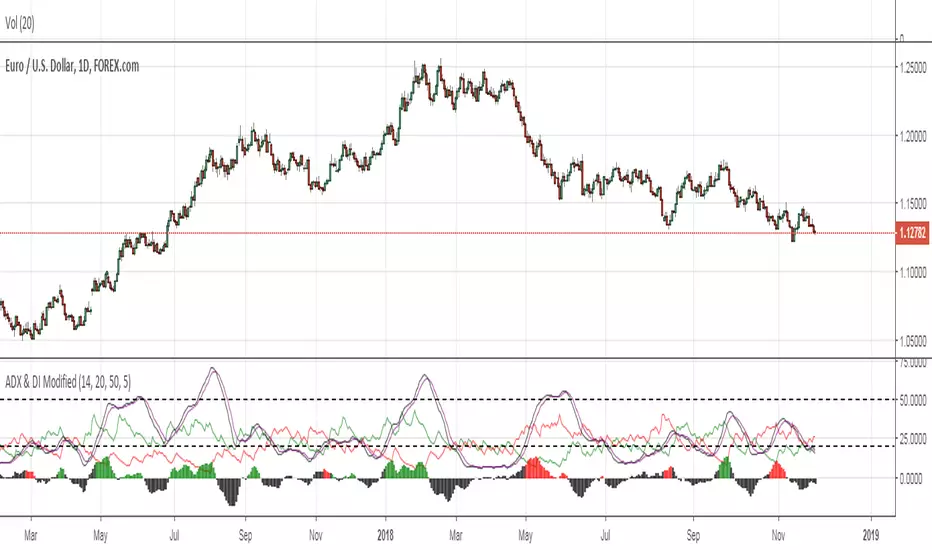
An EMA is applied to the ADX in order to catch the exhaustion of a trend (i.e. ADX line crossunder EMAADX line) or the possible formation of a new one. In the first case, we would wait a confirmation signal, which happens when the crossunder has a value greater then 50. A new trend is created when the difference between the ADX and the EMAADX is positive, with ADX greater then 20. As confirmation, we would have the DI+ greater then 20 e the DI- smaller then 20 (this would trigger a bullish sentiment, bearish for the opposite), consequently the histogram will be display in green (red in the bearish case).
オープンソーススクリプト
TradingViewの精神に則り、このスクリプトの作者はコードをオープンソースとして公開してくれました。トレーダーが内容を確認・検証できるようにという配慮です。作者に拍手を送りましょう!無料で利用できますが、コードの再公開はハウスルールに従う必要があります。
免責事項
この情報および投稿は、TradingViewが提供または推奨する金融、投資、トレード、その他のアドバイスや推奨を意図するものではなく、それらを構成するものでもありません。詳細は利用規約をご覧ください。
オープンソーススクリプト
TradingViewの精神に則り、このスクリプトの作者はコードをオープンソースとして公開してくれました。トレーダーが内容を確認・検証できるようにという配慮です。作者に拍手を送りましょう!無料で利用できますが、コードの再公開はハウスルールに従う必要があります。
免責事項
この情報および投稿は、TradingViewが提供または推奨する金融、投資、トレード、その他のアドバイスや推奨を意図するものではなく、それらを構成するものでもありません。詳細は利用規約をご覧ください。