INVITE-ONLY SCRIPT
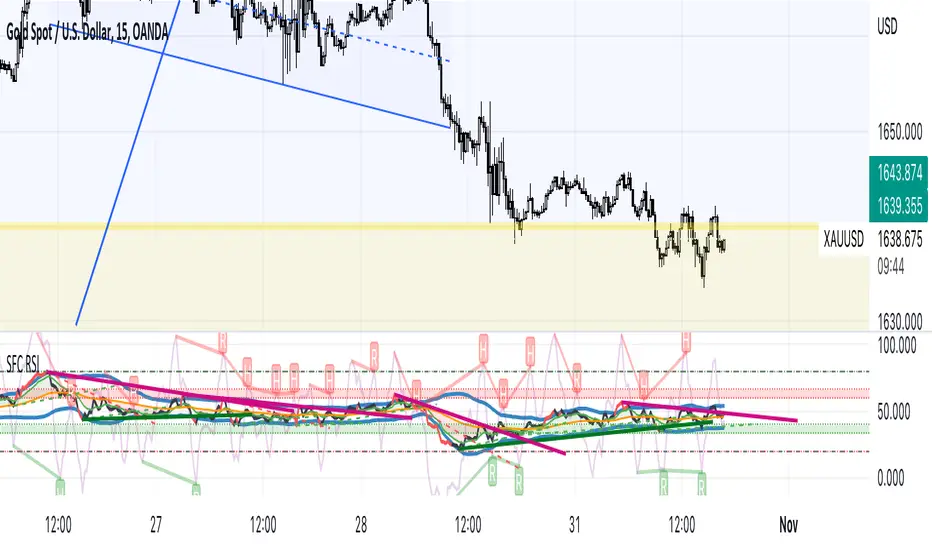
SFC RSI

This indicator can provide advanced information about the current market:
1. Divergence
Divergence do not mean only reversal but retracement too. Divergences not happen at every retracement, but 90% of the time. With divergences you can predict the pull backs. If RSI fail to make a divergence, composite index will do. That is why divergences from Composite Index are more reliable.
- Hidden divergence shows when pull back is over.
2. RSI Ranges
o If RSI moves between 60 and 40 – probably the market consolidate
o If RSI reach 80 or 20 –price probably will retrace
3. RSI Bands
In normal market condition RSI should be contained by the bands. If RSI goes out of the
bands, it represent overbought or oversold market.
4. RSI Moving Averages
- Moving averages represent dynamic support and resistance
- If fast moving average is above slow – it is bullish market condition and vice versa
5. Trend lines
Trend lines represent static support and resistance
6. Patterns and Elliot waves
- Chart patterns can be drawn to RSI , same as the chart
- Elliot Wave principle can be applied
RSI can give provide much more information about the price, for example:
- If RSI break support or resistance, price will follow it
- If divergence appear, price will go back to the origin point
- Fibonacci levels can be also applied. Important levels are 61.8% and 38.2%
RSI can be displayed as Heikin Ashi candles, in order to give you more smoother signal about the current trend.
招待専用スクリプト
このスクリプトへのアクセスは作者が許可したユーザーに制限されており、通常はお支払いが必要です。お気に入りに追加することはできますが、許可を申請して作者が許可した後でなければ使用することはできません。 詳細については SerpentForexClub にお問い合わせいただくか、以下の作者の指示に従ってください。
このスクリプトは、スクリプトのモデレーターによって分析が行われていないプライベートな招待専用スクリプトであることにご注意ください。ハウスルールに準拠しているかは不明です。 スクリプトの動作を理解していて作者も100%信頼できるということでなければ、TradingViewとしてはお金を払ってまでスクリプトを利用するのはお勧めしません。そのかわりに、コミュニティスクリプトでオープンソースの優れたスクリプトが無料で見つけられることが多々あります。
作者の指示
″Just send me a message.
チャートでこのスクリプトを利用したいですか?
注: アクセス権をリクエストされる前にこちらをご覧ください。
免責事項
これらの情報および投稿は、TradingViewが提供または保証する金融、投資、取引、またはその他の種類のアドバイスや推奨を意図したものではなく、またそのようなものでもありません。詳しくは利用規約をご覧ください。