INVITE-ONLY SCRIPT
更新済 Smoothed Candles
It is a graphical indicator used to identify trends and pullbacks. Through it, it is possible to eliminate the noises and clearly see the smoothed pattern.
How should I use it ? This is just a example to be used with this indicator.
Let's assume that we are looking for sell opportunities.

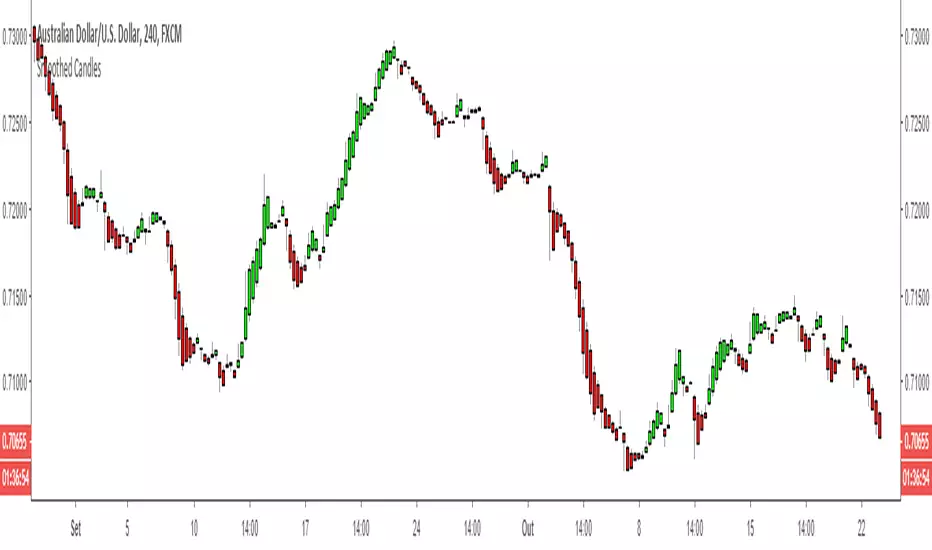
 AUDUSD
The example can be better described in the image below:

 EURUSD
Another example os use, displayed in the image below:

 EURJPY
Look how makes it easy to identify tops and bottoms.

 BTCUSD
Very easy to indetify trends:

 GBPUSD
Very easy to indetify pullbacks:

AUDGBP

It can be used with almost of pairs!
You can buy the script here:
http://502a96d9.ngrok.io
How should I use it ? This is just a example to be used with this indicator.
Let's assume that we are looking for sell opportunities.
- step 1: identify some (at least 3) positives (green) candles with a good volume, excluding consolidation regions.
- step 2: wait for negative (red) candles with a good volume and also all previous candles must be by majority green.
- step 3: wait for pullback with high volume or consolidation region to close the position.
The example can be better described in the image below:
Another example os use, displayed in the image below:
Look how makes it easy to identify tops and bottoms.
Very easy to indetify trends:
Very easy to indetify pullbacks:
It can be used with almost of pairs!
You can buy the script here:
http://502a96d9.ngrok.io
リリースノート
It is a graphical indicator used to identify trends and pullbacks. Through it, it is possible to eliminate the noises and clearly see the smoothed pattern. How should I use it ? This is just a example to be used with this indicator.
Let's assume that we are looking for sell opportunities.
step 1: identify some (at least 3) positives (green) candles with a good volume , excluding consolidation regions.
step 2: wait for negative (red) candles with a good volume and also all previous candles must be by majority green.
step 3: wait for pullback with high volume or consolidation region to close the position.
The example can be better described in the image below:
Another example os use, displayed in the image below:
Look how makes it easy to identify tops and bottoms.
Very easy to indetify trends:
Very easy to indetify pullbacks:
It can be used with almost of pairs!
You can buy the script here:
https://perfect-cat-87.localtunnel.me
リリースノート
It is a graphical indicator used to identify trends and pullbacks. Through it, it is possible to eliminate the noises and clearly see the smoothed pattern. How should I use it ? This is just a example to be used with this indicator.
Let's assume that we are looking for sell opportunities.
step 1: identify some (at least 3) positives (green) candles with a good volume , excluding consolidation regions.
step 2: wait for negative (red) candles with a good volume and also all previous candles must be by majority green.
step 3: wait for pullback with high volume or consolidation region to close the position.
The example can be better described in the image below:
Another example os use, displayed in the image below:
Look how makes it easy to identify tops and bottoms.
Very easy to indetify trends:
Very easy to indetify pullbacks:
It can be used with almost of pairs!
You can check the script here:
https://perfect-cat-87.localtunnel.me
招待専用スクリプト
このスクリプトは作者が承認したユーザーのみアクセス可能です。使用するにはアクセス申請をして許可を得る必要があります。通常は支払い後に承認されます。詳細は下記の作者の指示に従うか、FranciscoBiasoに直接お問い合わせください。
TradingViewは、作者を完全に信頼し、スクリプトの動作を理解していない限り、有料スクリプトの購入・使用を推奨しません。コミュニティスクリプトには無料のオープンソースの代替が多数あります。
作者の指示
免責事項
この情報および投稿は、TradingViewが提供または推奨する金融、投資、トレード、その他のアドバイスや推奨を意図するものではなく、それらを構成するものでもありません。詳細は利用規約をご覧ください。