INVITE-ONLY SCRIPT
Legacy SMT Indicator
アップデート済

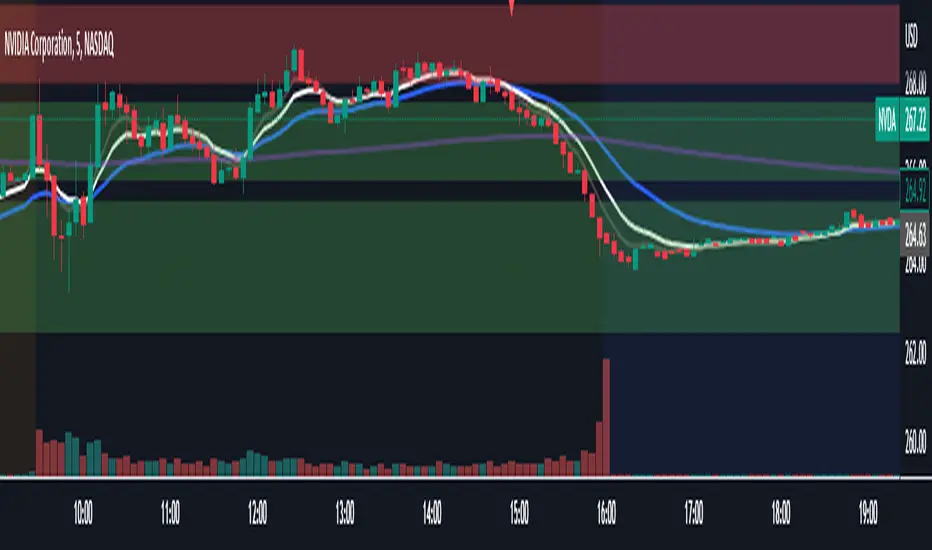
The script will plot the following EMAs:
5, 9, 21, and 200
The user will be able to choose what color and format the EMA will be in but the periods are set.
The indicator's primary purpose is to look for areas of potential momentum shifts (i.e. ema crossovers). However, this indicator is unique in that it will only give a signal if 2 other criteria are met along with the 9 and 21 ema crossover.
The criteria are as follows:
A "sell" signal will be generated if a bearish 9/21 ema crossover occurs while 2 other confirming conditions are present. Alerts are configurable.
A "buy" signal will be generated if a bullish 9/21 ema crossover occurs while while 2 other confirming conditions are present. Alerts are configurable
The script will also plot the previous HOD and LOD of the SPY ETF as horizontal lines (extended in both directions) that can be configured with whatever color the user prefers.
Mar 25
Release Notes:
Added functionality to allow the user decide what market hours alerts will be triggered during (i.e. 9:30-16:30)
リリースノート
Noneリリースノート
Added supply and demand zonesリリースノート
Removed zones until free version issue is addressedリリースノート
fixed market hour filtering on signalsリリースノート
bug fixリリースノート
Added EMA cloud functionality招待専用スクリプト
このスクリプトへのアクセスは作者が許可したユーザーに制限されており、通常はお支払いが必要です。お気に入りに追加することはできますが、許可を申請して作者が許可した後でなければ使用することはできません。 詳細については StockManTrading にお問い合わせいただくか、以下の作者の指示に従ってください。
このスクリプトは、スクリプトのモデレーターによって分析が行われていないプライベートな招待専用スクリプトであることにご注意ください。ハウスルールに準拠しているかは不明です。 スクリプトの動作を理解していて作者も100%信頼できるということでなければ、TradingViewとしてはお金を払ってまでスクリプトを利用するのはお勧めしません。そのかわりに、コミュニティスクリプトでオープンソースの優れたスクリプトが無料で見つけられることが多々あります。
チャートでこのスクリプトを利用したいですか?
注: アクセス権をリクエストされる前にこちらをご覧ください。
免責事項
これらの情報および投稿は、TradingViewが提供または保証する金融、投資、取引、またはその他の種類のアドバイスや推奨を意図したものではなく、またそのようなものでもありません。詳しくは利用規約をご覧ください。