INVITE-ONLY SCRIPT
BOSS Bullish/Bearish Quantitative Qualitative Estimation (QQE)
アップデート済
THE BEST FOREX, BINARY OPTIONS, AND CRYPTO INDICATORS FOR TRADINGVIEW.COM
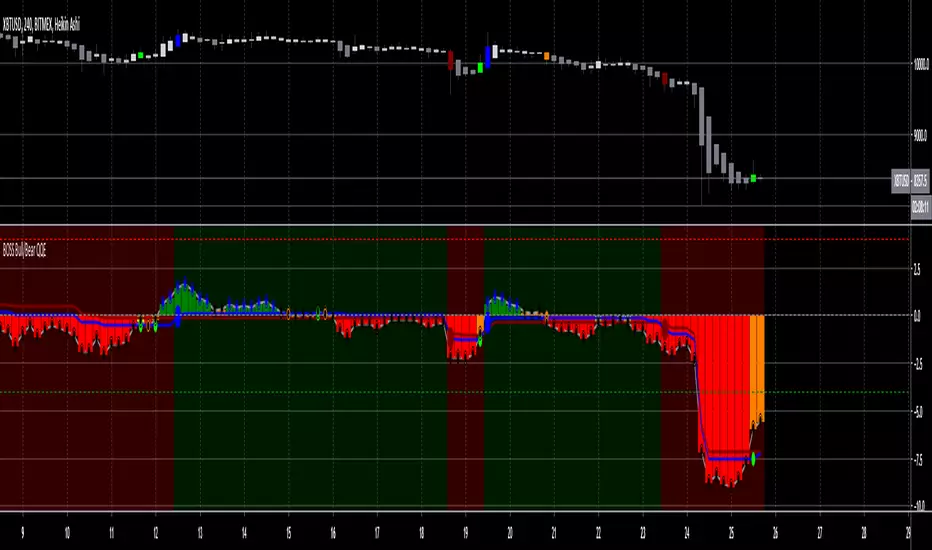
This indicator is comprised by a smoothed Relative Strength Index and two trailing levels, based on volatility – Fast Trailing Level (Fast TL – the maroon line on the chart above) and Slow Trailing Level (Slow TL – the blue line on the chart above).
The two are determined by calculating the Average True Range (ATR) of the smoothed RSI during a specified number of periods, after which a further ATR smoothing is applied with the use of an additional n-periods Wilders smoothing function.
Ultimately, the RSI’s smoothed ATR is multiplied by the Fast and Slow ATR Multipliers in order to determine the final Fast and Slow Trailing Levels.
Trading the QQE buy and sell signals:
Buy Signal
Bullish crossover happens when Fast ATR TL crosses above Slow ATR TL. When this occurs a blue circle & blue candle will appear and a alert signal to buy is generated.
Sell Signal
Bearish crossover happens when Slow ATR TL crosses above Fast ATR TL. When this occurs a maroon circle & maroon candle will appear and a alert signal to sell is generated.
Bullish/Bearish Divergence Background
Green background indicates Bullish Divergence
Red background indicates Bearish Divergence
Overbought and Oversold Conditions
An overbought condition occurs, when the QQE is at or above its 0.10 level.
An oversold condition occurs, when the QQE is at or below its -.10 level.
リリースノート
RSI Buy Signal Bullish crossover happens when RSI crosses above Fast ATR TL . When this occurs a lime circle will appear and a alert signal to buy is generated.
RSI Sell Signal
Bearish crossover happens when RSI crosses below Fast ATR TL. When this occurs a orange circle will appear and a alert signal to sell is generated.
**RSI is Gray Line On Chart
リリースノート
Changed Fast ATR Trailing Line Multiplier from 1.618 to 2.618リリースノート
updated bar colorリリースノート
added candle color to correlate with bullish and bearish RSI crossoversリリースノート
added RSI cross candle color correlation リリースノート
black fish-eye = stay in short positionblue fish-eye = stay in long position
set alerts to once per bar
at mid-line crossover you will receive two alerts this indicates time to close long or short position and open a long or short position.
招待専用スクリプト
このスクリプトへのアクセスは作者が許可したユーザーに制限されており、通常はお支払いが必要です。お気に入りに追加することはできますが、許可を申請して作者が許可した後でなければ使用することはできません。 詳細については TradingSafely にお問い合わせいただくか、以下の作者の指示に従ってください。
スクリプトの動作を理解していて作者も100%信頼できるということでなければ、TradingViewとしてはお金を払ってまでスクリプトを利用するのはお勧めしません。そのかわりに、コミュニティスクリプトでオープンソースの優れたスクリプトが無料で見つけられることが多々あります。
作者の指示
″
チャートでこのスクリプトを利用したいですか?
注: アクセス権をリクエストされる前にこちらをご覧ください。
🚀 LinkTree: linktr.ee/TradingSafely
📊 SECTOR SPDR ETFs: tradingsafely.net/spdr
🚨 Trade Ideas: tradingsafely.net/trade-ideas/
📈 StockTwits: stocktwits.com/r/TradingSafely
📚 TV Course: bit.ly/32sLUBo
📊 SECTOR SPDR ETFs: tradingsafely.net/spdr
🚨 Trade Ideas: tradingsafely.net/trade-ideas/
📈 StockTwits: stocktwits.com/r/TradingSafely
📚 TV Course: bit.ly/32sLUBo
免責事項
これらの情報および投稿は、TradingViewが提供または保証する金融、投資、取引、またはその他の種類のアドバイスや推奨を意図したものではなく、またそのようなものでもありません。詳しくは利用規約をご覧ください。