INVITE-ONLY SCRIPT
MBY_Quant_Hercules_Ver.Custom
Hello.
This is MBY Lab.
We are very excited to deploy Hercules metrics.
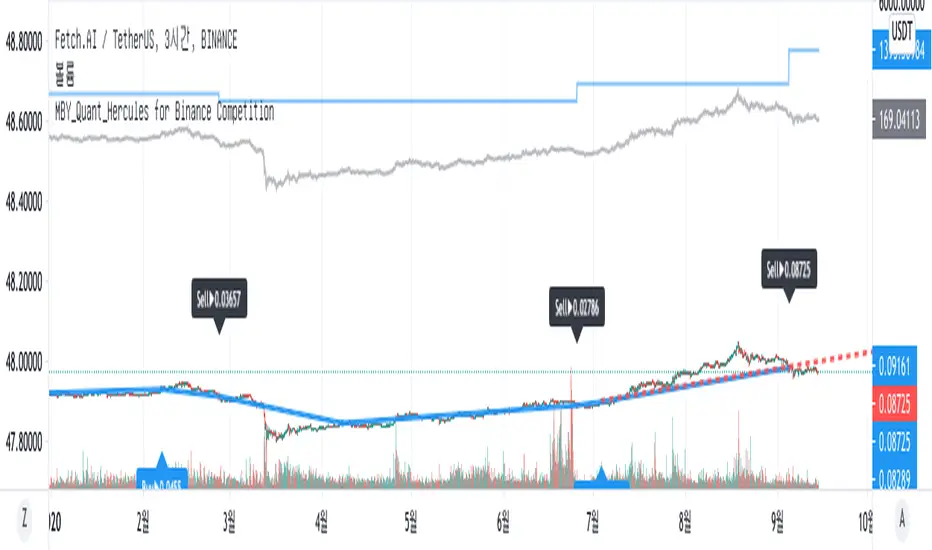
Hercules strategy operates based on the Relative Strength Index , and displays the price when each Relative Strength Index maintains an upward trend or decreases.
When the stock price rises, the price at the time of entering the overbought or oversold section is displayed as the market price, or when the relative strength index falls when the stock price rises, it is captured and the market price is displayed.
Therefore, this indicator is a momentum indicator , and it can be said to be a non-trend following indicator.
The blue line that outputs as blue shows a graph of the asset change when buying or selling at the price pointed to by this indicator, including 0.2% slippage and 0.2% transaction fee.
Of course, this doesn't mean that this metric is always profitable.
This strategy was created to aid trading.
This indicator is a private indicator, please comment if you wish to use it.
And this version is for VSOP
**notice**
"Use the link(Invite only script Contact) below to obtain access to this indicator".
This is MBY Lab.
We are very excited to deploy Hercules metrics.
Hercules strategy operates based on the Relative Strength Index , and displays the price when each Relative Strength Index maintains an upward trend or decreases.
When the stock price rises, the price at the time of entering the overbought or oversold section is displayed as the market price, or when the relative strength index falls when the stock price rises, it is captured and the market price is displayed.
Therefore, this indicator is a momentum indicator , and it can be said to be a non-trend following indicator.
The blue line that outputs as blue shows a graph of the asset change when buying or selling at the price pointed to by this indicator, including 0.2% slippage and 0.2% transaction fee.
Of course, this doesn't mean that this metric is always profitable.
This strategy was created to aid trading.
This indicator is a private indicator, please comment if you wish to use it.
And this version is for VSOP
**notice**
"Use the link(Invite only script Contact) below to obtain access to this indicator".
招待専用スクリプト
このスクリプトは作者が承認したユーザーのみアクセス可能です。使用するにはアクセス申請をして許可を得る必要があります。通常は支払い後に承認されます。詳細は下記の作者の指示に従うか、Yonggg92に直接お問い合わせください。
TradingViewは、作者を完全に信頼し、スクリプトの動作を理解していない限り、有料スクリプトの購入・使用を推奨しません。コミュニティスクリプトには無料のオープンソースの代替が多数あります。
作者の指示
Hi, im Quant from KR
免責事項
この情報および投稿は、TradingViewが提供または推奨する金融、投資、トレード、その他のアドバイスや推奨を意図するものではなく、それらを構成するものでもありません。詳細は利用規約をご覧ください。