INVITE-ONLY SCRIPT
HL MAs
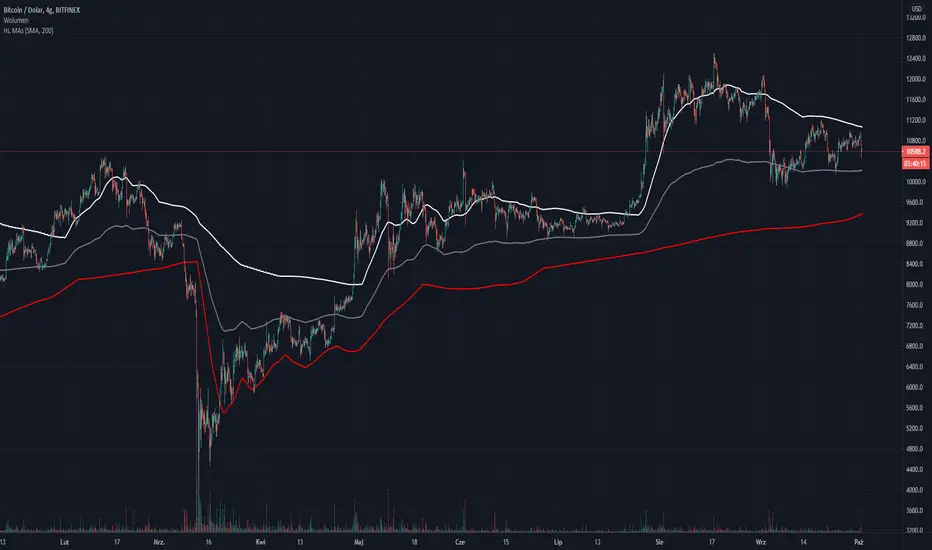
Main features of this script are:
* To show always highest and lowest value from given Moving Averages of certain intervals (30min, 1h, 2h, 4h. 6h, 12h, 1D, 3D, 1W to choose from, multiple choices are possible and desired).
* It also draws the middle line made of highest and lowest MA lines.
* If you would like to see all the MAs to see how its working you can turn them on from the scripts options ("Show all MAs").
* You may switch between SMA and EMA.
* You may set the length of which MAs on all set intervals will be calculated.
* The plus of using this is also that no matter what interval you have on chart, you will always see MAs from set up intervals, so lines will be always in the same places on chart.
ps. This script is invite-only for the members of our trading group (info in signature, group is free of charge).
招待専用スクリプト
こちらのスクリプトにアクセスできるのは投稿者が承認したユーザーだけです。投稿者にリクエストして使用許可を得る必要があります。通常の場合、支払い後に許可されます。詳細については、以下、作者の指示をお読みになるか、hiddenpabloに直接ご連絡ください。
スクリプトの機能を理解し、その作者を全面的に信頼しているのでなければ、お金を支払ってまでそのスクリプトを利用することをTradingViewとしては「非推奨」としています。コミュニティスクリプトの中で、その代わりとなる無料かつオープンソースのスクリプトを見つけられる可能性もあります。
作者の指示
We are group of mostly Polish traders but welcome everyone to join our Discord crypto&fx group: ChartInsiders.com
- discord.gg/HyzyrtnpP3
My Twitter Account: twitter.com/Crypto_Investor
- discord.gg/HyzyrtnpP3
My Twitter Account: twitter.com/Crypto_Investor
免責事項
これらの情報および投稿は、TradingViewが提供または保証する金融、投資、取引、またはその他の種類のアドバイスや推奨を意図したものではなく、またそのようなものでもありません。詳しくは利用規約をご覧ください。