INVITE-ONLY SCRIPT
Average Range Levels [Pro+]
アップデート済
Description:
The Average Range Levels [Pro+] builds on the concepts of ADR projections showcased in its lite version.
https://www.tradingview.com/script/Xt7Xg6sC-ICT-ADR-Levels-Judas-x-Daily-Range-Meter/
Average Daily Range (ADR) is a common metric used to measure volatility in an asset. It calculates the average difference between the highest and lowest price over a time interval – normally five days.
The Inner Circle Trader teaches the importance of this metric from an algorithmic point of view; in particular the 1/3ADR price level is deemed to be a threshold used to determine the area at which a Judas Swing – false move to trick market participants, protraction, manipulation – might exhaust.
Another key difference in the ICT-use of this metric compared to the classic approach is that the average range is calculated from New York midnight Time, rather than the daily candle's open. This exact concept was upscaled to higher Timeframe fractals obtaining the Average Weekly Range (AWR) and the Average Monthly Range (AMR). The latter two metrics are anchored at the first Monday’s midnight (New York Time) of the respective interval – however they also have the option to be anchored at the True Week Open (Tuesday’s Daily Open) and True Month Open (Second Week Open).
It is crucial to remember that the elements of Time are key when it comes to interpreting how price action will, or won't, react to these levels: what Time of the day is it? what day of the week? what week of the month?
If one thinks about the Power of Three of a candle (Accumulation, Manipulation Distribution), it is highly unlikely that a Manipulation event will happen later in the candle’s development – seeing the 1/3ADR hold in London session or New York open, seeing the 1/3AWR hold on Tuesday or Wednesday, or seeing price race to the 1/3AMR early on in the month gives undeniable edge to an Analyst.
Apart from the 1/3 level seen from a Judas perspective, the opposing 1/3 level, and the full AR projections, are excellent algorithmic levels at which we will see orderflow or reactions worth studying. These can be take profit targets, reversal opportunities, pyramid entries, …
Last but not least, the tool is equipped with a Data Table. You have a clear narrative but you are unsure of when price will expand? Track the previous 5 ARs and the current Range for Daily, Weekly, and Monthly – the smaller the AR the higher the chance for an expansion, the larger the AR the higher the chance for a consolidation.
Tool Features:
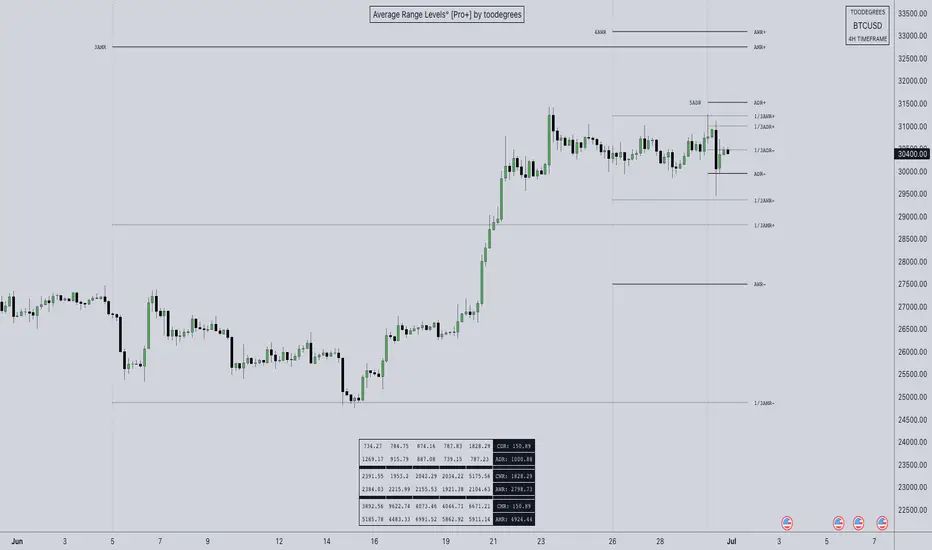
In the Idea below, you can see how BTCUSD hit the 1/3AMR level at the end of the second week of the month. The subsequent rejection from this level suggests we might have witnessed a Judas Swing, hence we flip to bullish bias.

In the more recent AWR levels, we can see how price did not touch any level until friday – this is a consolidation week with low probability setups. This was expected, if one looks at the precious two week's ranges and respective average ranges in the Data Table: both breached the AR value, due to to the great expansion higher.

Lastly for the ADR levels we can see how the Judas higher got beautifully stopped at the 1/3 level, and the full ADR level on the opposite side catches price while it falls.

To Get Access, and Level Up see the Author's Instructions below!
This indicator is available only on the TradingView platform.
⚠️ Intellectual Property Rights ⚠️
While this tool's base concepts are public, its interpretation, code, and presentation are protected intellectual property. Unauthorized copying or distribution is prohibited.
⚠️ Terms and Conditions ⚠️
This financial tool is for educational purposes only and not financial advice. Users assume responsibility for decisions made based on the tool's information. Past performance doesn't guarantee future results. By using this tool, users agree to these terms.
The Average Range Levels [Pro+] builds on the concepts of ADR projections showcased in its lite version.
https://www.tradingview.com/script/Xt7Xg6sC-ICT-ADR-Levels-Judas-x-Daily-Range-Meter/
Average Daily Range (ADR) is a common metric used to measure volatility in an asset. It calculates the average difference between the highest and lowest price over a time interval – normally five days.
The Inner Circle Trader teaches the importance of this metric from an algorithmic point of view; in particular the 1/3ADR price level is deemed to be a threshold used to determine the area at which a Judas Swing – false move to trick market participants, protraction, manipulation – might exhaust.
Another key difference in the ICT-use of this metric compared to the classic approach is that the average range is calculated from New York midnight Time, rather than the daily candle's open. This exact concept was upscaled to higher Timeframe fractals obtaining the Average Weekly Range (AWR) and the Average Monthly Range (AMR). The latter two metrics are anchored at the first Monday’s midnight (New York Time) of the respective interval – however they also have the option to be anchored at the True Week Open (Tuesday’s Daily Open) and True Month Open (Second Week Open).
It is crucial to remember that the elements of Time are key when it comes to interpreting how price action will, or won't, react to these levels: what Time of the day is it? what day of the week? what week of the month?
If one thinks about the Power of Three of a candle (Accumulation, Manipulation Distribution), it is highly unlikely that a Manipulation event will happen later in the candle’s development – seeing the 1/3ADR hold in London session or New York open, seeing the 1/3AWR hold on Tuesday or Wednesday, or seeing price race to the 1/3AMR early on in the month gives undeniable edge to an Analyst.
Apart from the 1/3 level seen from a Judas perspective, the opposing 1/3 level, and the full AR projections, are excellent algorithmic levels at which we will see orderflow or reactions worth studying. These can be take profit targets, reversal opportunities, pyramid entries, …
Last but not least, the tool is equipped with a Data Table. You have a clear narrative but you are unsure of when price will expand? Track the previous 5 ARs and the current Range for Daily, Weekly, and Monthly – the smaller the AR the higher the chance for an expansion, the larger the AR the higher the chance for a consolidation.
Tool Features:
- Auto Color the drawings based on your chart’s background or choose your own
- Decide whether to consider daily candles, or New York (00:00 to 00:00 NY Time) for the basis of the calculation
- Show the last 10 Historical Levels
– See the AR Range, the AR price levels and 1/3AR price levels by hovering over the text labels
- Plot the AR levels from their Time Anchor, or as offset markers on the side for a cleaner look
- Show/Hide all elements individually
In the Idea below, you can see how
In the more recent AWR levels, we can see how price did not touch any level until friday – this is a consolidation week with low probability setups. This was expected, if one looks at the precious two week's ranges and respective average ranges in the Data Table: both breached the AR value, due to to the great expansion higher.
Lastly for the ADR levels we can see how the Judas higher got beautifully stopped at the 1/3 level, and the full ADR level on the opposite side catches price while it falls.
To Get Access, and Level Up see the Author's Instructions below!
This indicator is available only on the TradingView platform.
⚠️ Intellectual Property Rights ⚠️
While this tool's base concepts are public, its interpretation, code, and presentation are protected intellectual property. Unauthorized copying or distribution is prohibited.
⚠️ Terms and Conditions ⚠️
This financial tool is for educational purposes only and not financial advice. Users assume responsibility for decisions made based on the tool's information. Past performance doesn't guarantee future results. By using this tool, users agree to these terms.
リリースノート
Bug Fix:- Table dividers were plotting in wrong conditions
- AR and CR update together on New Candle Open
- Better "Plot from Anchor" behaviour
Updates
- Must be below 1D chart to see Average Range Levels
- If there is insufficient data to make a calculation the level will not plot
- When there is not enough historical values the Data Table will display "NaN"
- Uniform terminology is now in place
リリースノート
Updated Main Chart Imageリリースノート
Optimization: better data fetching -> faster and more accurateリリースノート
Minor Bug Fixesリリースノート
Minor Bug Fixリリースノート
Update:- Added option to display "Historical", "Current", or "Both" in the Data Table
- Added Universal Alerts for all Average Range Levels!
リリースノート
Update: added option to hide warning.リリースノート
UpdateAdded ability to show specific Average Range Types between certain Timeframes; where LowerTF <= CurrentTF < HigherTF
リリースノート
Bug Fix:- Due to open candle Time above Daily, AR Levels cannot be plotted on HTF, fixed
- The AWR, and the AMR were plotting from the beginning of the year, fixed
リリースノート
Bug Fix: the monthly table data plotted even if turned off, fixedリリースノート
Weekly and Monthly Historical Levels Fixリリースノート
Code Cleanupリリースノート
To see the updated version, remove and re-add the tool to your chart.- Added MTF Calculations! Levels are now displayed on any Timeframe!
- Cleaned up the Settings' UI – now simpler and straight forward
- Fixed bug where monthly levels were calculated incorrectly
リリースノート
Minor Bug Fixes- Fixed AMR reset logic – new month over the weekend was not detected
リリースノート
Few Features:- Added Current Levels Table
- Added Choice of Price/Pips/Ticks for Previous Ranges Table
Bug Fixes:
- Fixed Forex ADR levels being inaccurate
- Fixed Forex AWR levels being inaccurate
- Fixed rounding of levels on assets, now rounded to asset's minimum tick size
リリースノート
Minor Bug Fixesリリースノート
Minor Bug Fixes招待専用スクリプト
このスクリプトへのアクセスは作者が許可したユーザーに制限されており、通常はお支払いが必要です。お気に入りに追加することはできますが、許可を申請して作者が許可した後でなければ使用することはできません。 詳細については toodegrees にお問い合わせいただくか、以下の作者の指示に従ってください。
スクリプトの動作を理解していて作者も100%信頼できるということでなければ、TradingViewとしてはお金を払ってまでスクリプトを利用するのはお勧めしません。そのかわりに、コミュニティスクリプトでオープンソースの優れたスクリプトが無料で見つけられることが多々あります。
作者の指示
″To see the updated version, remove and re-add the tool to your chart.
Get access here: https://www.toodegrees.trade/levelup/averagerangelevels
チャートでこのスクリプトを利用したいですか?
注: アクセス権をリクエストされる前にこちらをご覧ください。
homo faber fortunæ suæ
免責事項
これらの情報および投稿は、TradingViewが提供または保証する金融、投資、取引、またはその他の種類のアドバイスや推奨を意図したものではなく、またそのようなものでもありません。詳しくは利用規約をご覧ください。