INVITE-ONLY SCRIPT
Gann Square of 9 v2- M3M0
The Square of nine or Gann Square or Master Chart is also known as the square root calculator and finds its basis in Gann's methods which is squaring price and time. The square of 9 is a spiral of numbers with the initial value "1" starting at the centre. Starting from this central value, the number is increased as we move in a spiral form and a clockwise direction. According to some experts, each cell in Gann’s square of nine represents a point of vibration.
This indicator will automatically plot the Gann Level based on the Gann Square of 9 table.
How to trade with Gann Square of 9.
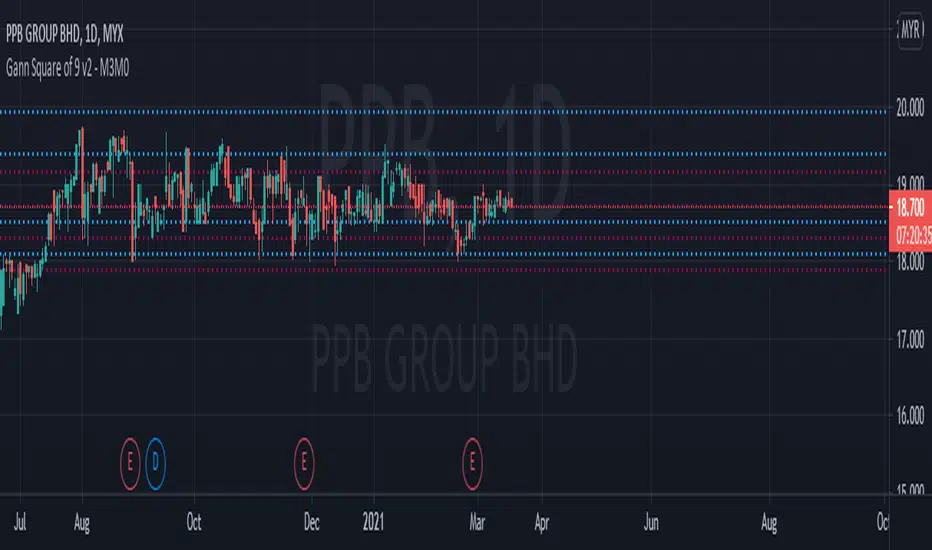
This indicator will automatically plot 4 lines above the current price and 4 lines below the current price, which is based on Gann Square of 9 table.
If the lines above the current price, it will be as resistance. If the lines below the current price, it will be as support.
The blue line is the strong level from Gann Square of 9 table while the red line is the very strong level from Gann Square of 9 table.
This indicator will automatically plot the Gann Level based on the Gann Square of 9 table.
How to trade with Gann Square of 9.
This indicator will automatically plot 4 lines above the current price and 4 lines below the current price, which is based on Gann Square of 9 table.
If the lines above the current price, it will be as resistance. If the lines below the current price, it will be as support.
The blue line is the strong level from Gann Square of 9 table while the red line is the very strong level from Gann Square of 9 table.
招待専用スクリプト
こちらのスクリプトにアクセスできるのは投稿者が承認したユーザーだけです。投稿者にリクエストして使用許可を得る必要があります。通常の場合、支払い後に許可されます。詳細については、以下、作者の指示をお読みになるか、mohdelyに直接ご連絡ください。
スクリプトの機能を理解し、その作者を全面的に信頼しているのでなければ、お金を支払ってまでそのスクリプトを利用することをTradingViewとしては「非推奨」としています。コミュニティスクリプトの中で、その代わりとなる無料かつオープンソースのスクリプトを見つけられる可能性もあります。
作者の指示
Please PM me if u need access to this indicator
免責事項
これらの情報および投稿は、TradingViewが提供または保証する金融、投資、取引、またはその他の種類のアドバイスや推奨を意図したものではなく、またそのようなものでもありません。詳しくは利用規約をご覧ください。