INVITE-ONLY SCRIPT
[SignalFI] H0dl2100K HA Trailer [V1]
アップデート済
Welcome! It's my pleasure to bring a fully customized indicator based on @h0dl2100K's HA candle trading system. Through concerted efforts to bring automated trading systems from some of the best technical traders around, SignalFI provides the following features that were approved by @h0dl2100K:
Background
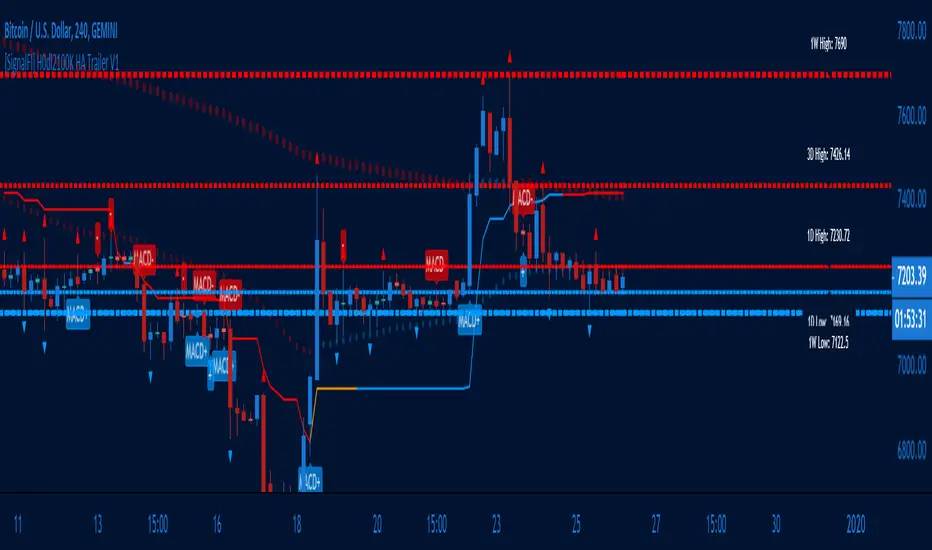
This system is based on the popular HA candle system and using several key levels and indicators of price action that can help identify entry, exit, and trailing stop levels for trading any asset (crypto, stocks, etc). The system is built to be used with HA candles, and provides the following key abilities:
1) HA Candle Doji Detector - HA candles are notorious for their ability to identify trend direction and changes in momentum. One of the easiest ways to identify these trend changes is when HA candles print "Doji candles" or candles that have long wicks on either side of the candle body. This signifies indecision in the market, and after a sustained up or down trend, usually marks a reversal in momentum. The Doji Detector will print label tags identifying potential bull or bear doji's which can be used as entry and exit signals or for identifying confluence with other indicators.
2) MTF Trail Lines - Using previous close levels for higher time frame candles is a cornerstone of trading fundamentals. Levels from the daily timeframe are respected on lower timeframes and can provide key levels to watch for entry or exit conditions to be "just right." The Trail lines are enabled by default and provide static levels on the chart in accordance with the following timeframes (4H, 12H, 1D, 3D, 1W). Both HIGH and LOW values for each timeframe are provided on the chart for easy of determining trailing stop levels or Take Profit levels depending on your trading system and confluence with other indicators.
3) EMA 50/200 - We've also included the notorious EMA trend lines that govern market sentiment from both short- and long-term investors (50 EMA, 200 EMA). These lines change color based on the price being above or below these levels and the levels can be fine-tuned within the settings to your EMA levels of choice.
4) MACD Crosses - We've also included signal tags where default MACD crosses occur to ensure that the trend direction is always presented on one graph. MACD crosses represent a significant sentiment score for trading all assets, and taken with the EMA trend, the HA candle trend, and the MTF Trail Levels can give a very consistent view of where price may be heading.
5) Alerts – It wouldn’t be a system unless we provided alerts to use for ease of notification of the data coming out of the script. For that reason, we have built-in alerts for both the MACD crosses and the Doji Detector. In addition, each Trail level be selected and alerted on to receive updates of when these key levels are crossed above or crossed below.
The H0dl2100K system is the result of years of market analysis and is mean to be a tool for guiding trading decisions in unison with or independently of other indicators. It works remarkably well with IchiEMA, AO and RSI PRIME as they all provide confluence to trading decisions, especially when using HA candles.
SignalFI was created to help traders and investors to effectively analyze the market based on the Golden Mean Ratio (Fibonacci numbers), plan a trade and ultimately execute it. To help inform and educate market decisions we developed a set of Trading Indicators which are available on TradingView.
SignalFI indicators are just that, indicators. Our indicators are generally configured to use completely historical data (negating repaint), and we advise all alerts created with SignalFI indicators to be fired upon "close" of the current candle. Our indicators can provide valuable context and visualization support when performing market analysis and executing buy and sell decisions. However. we are not financial experts, and all information presented on this site or our other media outlets are for educational purposes only.
Background
This system is based on the popular HA candle system and using several key levels and indicators of price action that can help identify entry, exit, and trailing stop levels for trading any asset (crypto, stocks, etc). The system is built to be used with HA candles, and provides the following key abilities:
1) HA Candle Doji Detector - HA candles are notorious for their ability to identify trend direction and changes in momentum. One of the easiest ways to identify these trend changes is when HA candles print "Doji candles" or candles that have long wicks on either side of the candle body. This signifies indecision in the market, and after a sustained up or down trend, usually marks a reversal in momentum. The Doji Detector will print label tags identifying potential bull or bear doji's which can be used as entry and exit signals or for identifying confluence with other indicators.
2) MTF Trail Lines - Using previous close levels for higher time frame candles is a cornerstone of trading fundamentals. Levels from the daily timeframe are respected on lower timeframes and can provide key levels to watch for entry or exit conditions to be "just right." The Trail lines are enabled by default and provide static levels on the chart in accordance with the following timeframes (4H, 12H, 1D, 3D, 1W). Both HIGH and LOW values for each timeframe are provided on the chart for easy of determining trailing stop levels or Take Profit levels depending on your trading system and confluence with other indicators.
3) EMA 50/200 - We've also included the notorious EMA trend lines that govern market sentiment from both short- and long-term investors (50 EMA, 200 EMA). These lines change color based on the price being above or below these levels and the levels can be fine-tuned within the settings to your EMA levels of choice.
4) MACD Crosses - We've also included signal tags where default MACD crosses occur to ensure that the trend direction is always presented on one graph. MACD crosses represent a significant sentiment score for trading all assets, and taken with the EMA trend, the HA candle trend, and the MTF Trail Levels can give a very consistent view of where price may be heading.
5) Alerts – It wouldn’t be a system unless we provided alerts to use for ease of notification of the data coming out of the script. For that reason, we have built-in alerts for both the MACD crosses and the Doji Detector. In addition, each Trail level be selected and alerted on to receive updates of when these key levels are crossed above or crossed below.
The H0dl2100K system is the result of years of market analysis and is mean to be a tool for guiding trading decisions in unison with or independently of other indicators. It works remarkably well with IchiEMA, AO and RSI PRIME as they all provide confluence to trading decisions, especially when using HA candles.
SignalFI was created to help traders and investors to effectively analyze the market based on the Golden Mean Ratio (Fibonacci numbers), plan a trade and ultimately execute it. To help inform and educate market decisions we developed a set of Trading Indicators which are available on TradingView.
SignalFI indicators are just that, indicators. Our indicators are generally configured to use completely historical data (negating repaint), and we advise all alerts created with SignalFI indicators to be fired upon "close" of the current candle. Our indicators can provide valuable context and visualization support when performing market analysis and executing buy and sell decisions. However. we are not financial experts, and all information presented on this site or our other media outlets are for educational purposes only.
リリースノート
1) Label placement for "High" levels changed to Above Line, instead of Below Line for formatting. 2) Changed source data pull to match normal candle values.
リリースノート
1) Formatting Changeリリースノート
1) Added Ichimoku Baseline for immediate trend following and support and resistance2) Added Ichimoku Span Cloud
3) Added Williams Fractals
リリースノート
Clean Codeリリースノート
1) Color Updatesリリースノート
1) Refactor Code2) MACD signal calculation changed from SMA to EMA to align with Tradingview default.
SignalFi is creating cutting edge TradingView scripts to help identify rogue market Alpha. Check out signalfi.net for subscription information and @signalfi_ on Twitter for updates.
招待専用スクリプト
このスクリプトへのアクセスは作者が許可したユーザーに制限されており、通常はお支払いが必要です。お気に入りに追加することはできますが、許可を申請して作者が許可した後でなければ使用することはできません。 詳細については SignalFi にお問い合わせいただくか、以下の作者の指示に従ってください。
このスクリプトは、スクリプトのモデレーターによって分析が行われていないプライベートな招待専用スクリプトであることにご注意ください。ハウスルールに準拠しているかは不明です。TradingViewは、スクリプトの作者を100%%信頼して、スクリプトの動作を理解しているといった場合でない限りは、代金を支払ってまで利用するのはお勧めしません。コミュニティスクリプトで、その代わりとなるオープンソースの優れたスクリプトが無料で見つかるケースも多くあります。
チャートでこのスクリプトを利用したいですか?
注: アクセス権をリクエストされる前にこちらをご覧ください。
免責事項
これらの情報および投稿は、TradingViewが提供または保証する金融、投資、取引、またはその他の種類のアドバイスや推奨を意図したものではなく、またそのようなものでもありません。詳しくは利用規約をご覧ください。