INVITE-ONLY SCRIPT
更新済 FibVIP2022TSLA
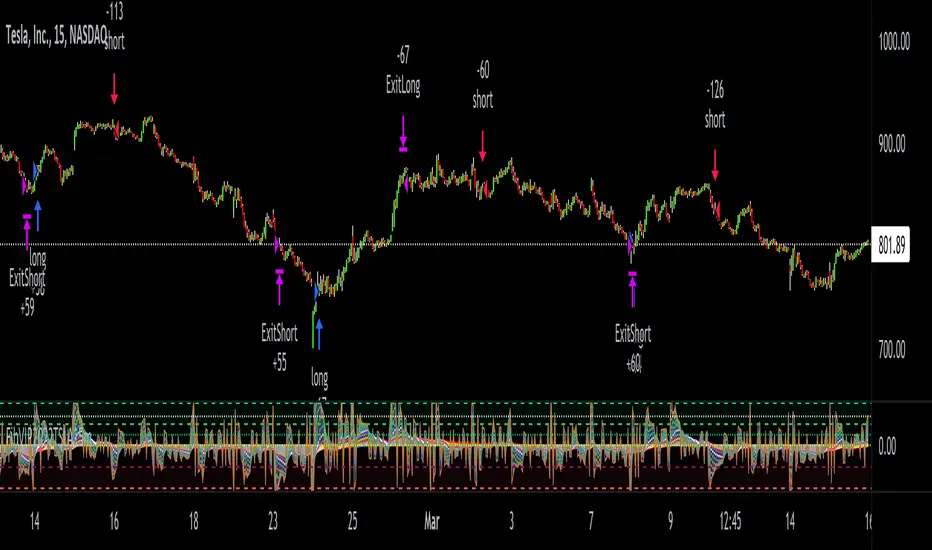
This is version 1.0 FibVIP2022TSLA Strategy. This has only been back tested for the ticker "TSLA" for the year 2022. And I real time capital tested it personally. The reason I isolated this strategy to 2022 is because Tesla's chart patterns have changed from the previous 2 years. So, I wanted to develop an indicator-based strategy that was consistent with current market conditions. The default setting for percent of equity is set to 5% risk. I will adjust any variables that make this FibVIP2022TSLA Strategy more accurate in the future as more 2022 data comes out.
It's based on my Fibonacci VIP indicator script. Fibonacci VIP (Fibonacci Volume Indicator Precision) is a volume indicator that I made to help me have precise entry and exit timing. It's based on the well-known Fibonacci sequence 1, 2, 3, 5, 8, 13, 21, 34, 55, 89, 144, 233. The default colors I like to use can be changed to whatever you want. The numbers inputted are based on volume ema.
Bullish momentum in ascending order is 21 = white, 13 = blue, 8 = green.
Bearish momentum descending order is 89 = red, 55 = yellow, 34 = purple.
Immediate momentum 1 = orange, 2 = blue, 3 = neon green, 5 = lime.
Long term momentum 144 = lime, 233 = teal.
Four high, mid high, mid low & low dashed channel lines with transparent fill colors lime, green, maroon & red. Also, there's a gray zero static line & white dynamic horizontal dotted line ema1 & ema8 to help keep momentum in perspective. The most bullish signal is when all colors are in a top-down order 1, 2, 3, 5, 8, 13, 21, 34, 55, 89, 144, 233. The most bearish signal is when all colors are reversed and have a bottom-up order of 233, 144, 89, 55, 34, 21, 13, 8, 5, 3, 2, 1.
A crossover, cross-under, divergence or convergence of these colors, help signal the future price action. For example, green crossing over red is bullish, but green crossing under red is bearish. If colors are low / below the zero line that's bearish and if they are above the zero line, that's bullish. The FibVIP works great as a leading indicator to confirm future price action of the underlying security momentum.
リリースノート
I changed the strategy chart title to "FibVIP2022TSLA15m" to remind this has been back tested for the ticker "TSLA" for the year 2022 on the 15-minute chart.リリースノート
I changed the strategy chart title to "FibVIP2022TSLA15m" to remind this has been back tested for the ticker "TSLA" for the year 2022 on the 15-minute regular hour chart.リリースノート
header update招待専用スクリプト
このスクリプトは作者が承認したユーザーのみアクセス可能です。使用するにはアクセス申請をして許可を得る必要があります。通常は支払い後に承認されます。詳細は下記の作者の指示に従うか、Options360に直接お問い合わせください。
TradingViewは、作者を完全に信頼し、スクリプトの動作を理解していない限り、有料スクリプトの購入・使用を推奨しません。コミュニティスクリプトには無料のオープンソースの代替が多数あります。
作者の指示
Send me a private message for instructions.
Trading indicators:
tradingview.com/u/Options360/
tradingview.com/u/Options360/
免責事項
この情報および投稿は、TradingViewが提供または推奨する金融、投資、トレード、その他のアドバイスや推奨を意図するものではなく、それらを構成するものでもありません。詳細は利用規約をご覧ください。
招待専用スクリプト
このスクリプトは作者が承認したユーザーのみアクセス可能です。使用するにはアクセス申請をして許可を得る必要があります。通常は支払い後に承認されます。詳細は下記の作者の指示に従うか、Options360に直接お問い合わせください。
TradingViewは、作者を完全に信頼し、スクリプトの動作を理解していない限り、有料スクリプトの購入・使用を推奨しません。コミュニティスクリプトには無料のオープンソースの代替が多数あります。
作者の指示
Send me a private message for instructions.
Trading indicators:
tradingview.com/u/Options360/
tradingview.com/u/Options360/
免責事項
この情報および投稿は、TradingViewが提供または推奨する金融、投資、トレード、その他のアドバイスや推奨を意図するものではなく、それらを構成するものでもありません。詳細は利用規約をご覧ください。