OPEN-SOURCE SCRIPT
更新済 MFI * %B [seiglerj]
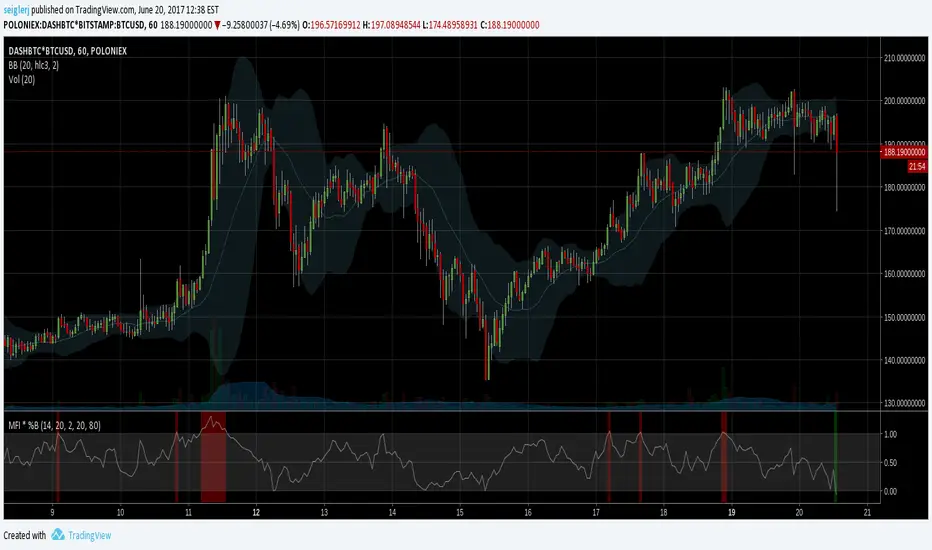
Oscillator averaging Money Flow Index and Bollinger Bands' %B
Colored bars indicate buy or sell signals
I have no idea if this is the right way to combine these two, but I'm gonna try it and see what happens
Colored bars indicate buy or sell signals
I have no idea if this is the right way to combine these two, but I'm gonna try it and see what happens
リリースノート
Renameリリースノート
add names to the plotsリリースノート
Change the combined signal to a min/max formula that only exceeds the bounds when both MFI and %B do. This reduces erroneous signals and more closely matches published MFI/%B strategies.オープンソーススクリプト
TradingViewの精神に則り、このスクリプトの作者はコードをオープンソースとして公開してくれました。トレーダーが内容を確認・検証できるようにという配慮です。作者に拍手を送りましょう!無料で利用できますが、コードの再公開はハウスルールに従う必要があります。
免責事項
この情報および投稿は、TradingViewが提供または推奨する金融、投資、トレード、その他のアドバイスや推奨を意図するものではなく、それらを構成するものでもありません。詳細は利用規約をご覧ください。
オープンソーススクリプト
TradingViewの精神に則り、このスクリプトの作者はコードをオープンソースとして公開してくれました。トレーダーが内容を確認・検証できるようにという配慮です。作者に拍手を送りましょう!無料で利用できますが、コードの再公開はハウスルールに従う必要があります。
免責事項
この情報および投稿は、TradingViewが提供または推奨する金融、投資、トレード、その他のアドバイスや推奨を意図するものではなく、それらを構成するものでもありません。詳細は利用規約をご覧ください。