VWAP Reversion (Sequential Stats + Profit/Loss Points)First time posting. This is my attempt to evaluate the effectiveness of VWAP reversion. I decided to make this an indicator with its own integrated stats.
If you set the session length to lets say 100, but choose a 1 minute timeframe, it will only load as many sessions as the chart will allow for that timeframe. increasing the timeframe will allow you to go back further with more sessions.
I plan to implement more and more as I refine it. I just wanted to get my working copy out into the universe. I'd like to add some method of "scaling in". Perhaps if the price goes further and further away from the original entry, say for each additional std. deviation band further, it could add another entry signal.
My trading journey is just beginning, I've never coded before, and this was made entirely through the fusion of my attempt to communicate the ideas in my head for ChatGPT to turn into code!
バンドとチャネル

Ultimate RSI Suite [BigBeluga]🔵 OVERVIEW
The Ultimate RSI Suite elevates the classic RSI into a full professional trading system.
It combines momentum analysis, advanced divergence detection, volatility-based RSI channels, multi-timeframe signals, deviation tracking, and reversal alerts into one powerful tool.
This is no ordinary RSI — it’s a complete momentum intelligence engine designed to identify trend strength, exhaustion, breakout conditions, and reliable reversal points with high precision.
⚠️ Note:
This suite enhances RSI with MTF dashboards, dynamic channels, deviation logic, and smart alerting — ideal for scalpers, swing traders, and institutional-style trend followers.
🔵 CONCEPTS
Measures market momentum to detect overbought/oversold zones and trend health
Tracks RSI behavior relative to dynamic channels (BB/Keltner/Donchian)
Identifies regular bullish & bearish divergences
Detects deviation moves after divergence to confirm trend continuation or exhaustion
Multi-timeframe RSI conditions reveal higher-timeframe confluence
Reversal triggers confirm early momentum shifts
Overbought/oversold gradients visually highlight exhaustion zones
🔵 FEATURES
Classic + Enhanced RSI with configurable lookback & price source
RSI-Channel System (Bollinger, Keltner, Donchian) for volatility-adaptive trend structure
RSI-Smoothing MA for trend direction filters
RSI Reversal Signals for early trend inflection detection
RSI Reversal Signals Deviation Levels +1 / +2 for advanced continuation confirmation
Overbought/Oversold Gradient Zones at 35/65 or user-defined levels
Divergence Engine for bullish & bearish momentum exhaustion signals
On-Chart Divergence & Signals (full overlay capability)
Divergence Engine Deviation Levels +1 / +2 for advanced continuation confirmation
Multi-Timeframe Dashboard (RSI OB/OS, signals, divergences, channel breaks)
• Hover your mouse over any signal cell to see how many bars ago it was triggered
• Signals automatically expire after 50 bars
Smart Alerts for divergence, reversals, channel breaks, and deviation triggers
🔵 HOW TO USE
Enter long when RSI reverses from oversold & prints bullish divergence or a ▲ signal
Enter short when RSI reverses from overbought & prints bearish divergence or ▼
Use channel breaks to confirm momentum expansions or trend shifts
Look for deviation crosses (+1 / +2) for strong confirmation after divergence
Track MTF table — more timeframe agreement = stronger conviction
Avoid trading against MTF RSI extremes (OB/OS stacked zones)
Combine with market structure or volume-based tools for maximum precision
🔵 ALERTS
Includes full automation suite:
Bullish / Bearish divergence
Reversal signals (▲ / ▼)
Channel breakouts (Up/Down)
Deviation +1 / +2 confirmation triggers
Extra RSI signal deviation alerts for precision continuation reads
Great for automated systems, confirmation models, and high-probability intraday/swing entries.
🔵 CONCLUSION
The Ultimate RSI Suite transforms RSI into a smart momentum-analysis system.
With multi-timeframe logic, dynamic channels, advanced divergence/deviation systems, and powerful visual cues, it offers institutional-grade trend, exhaustion, and reversal detection.
If you rely on RSI, this toolkit provides superior clarity, deeper context, and stronger execution timing — making it an elite upgrade for professional traders.
有料スクリプト

NEESON Plus Crypto Market Sentiment IndicatorCore Features
1. Multi-Factor Sentiment Scoring System
Comprehensive Algorithm: Combines 6 different market indicators
Weighted Scoring: Each factor contributes with different weights
Real-time Calculation: Updates with every new bar
Smoothing Mechanism: Triple EMA smoothing for stable signals
2. Advanced Technical Indicators Integration
Multi-Timeframe RSI: 1H, 4H, and Daily RSI analysis
Volume Analysis: Volume spikes and decline detection
ATR Volatility: Market volatility assessment
MACD Momentum: Trend momentum confirmation
Bollinger Bands: Price position analysis
3. Proprietary Indicator Calculations
AHR999 Proxy: Enhanced version for crypto markets
Puell Multiple Proxy: Dynamic calculation with RSI adjustment
PI Cycle Top: Multi-moving average cycle analysis
CBBI Enhanced: Crypto Bull Bear Index with momentum
Market Volatility Sentiment: Volatility-based sentiment scoring
Volume Sentiment: Volume-based market sentiment
Signal Generation System
4. Multi-Condition Signal Filters
Strong Buy/Sell Signals: Multiple confirmation requirements
Warning Signals: Early entry/exit indications
Confirmation Bars: User-configurable signal confirmation
Trend Filter: Optional trend alignment requirement
Volume Filter: Volume spike confirmation
Volatility Filter: ATR-based market condition filtering
Momentum Filter: MACD momentum confirmation
5. Advanced Signal Management
Signal State Tracking: Maintains current position state
Duration Tracking: Tracks how long signals have been active
Entry Score Recording: Records sentiment score at entry
Consecutive Signal Counting: Prevents signal flipping
Exit Conditions: Multiple exit criteria for risk management
Visualization Features
6. Professional Chart Display
Dual Score Plotting: Comprehensive and raw sentiment scores
Color-Coded Background: Real-time market sentiment coloring
Threshold Lines: Clear visual reference levels
Area Fills: Colored zones for different sentiment levels
Signal Markers: Visual indicators for buy/sell signals
7. Information Panel
Real-time Data Display: Current scores and signals
Position Tracking: Duration and entry information
Performance Metrics: Floating P/L calculation
Market Status: RSI, Volume, Volatility, MACD status
Configuration Status: Current filter settings
Customization Options
8. User-Configurable Parameters
Threshold Settings: Adjustable buy/sell/exit levels
Filter Toggles: Enable/disable various filters
Indicator Periods: Customizable calculation periods
Color Settings: Fully customizable color scheme
Signal Duration: Minimum signal duration requirements
9. Alert System
Strong Buy/Sell Alerts: Immediate notification for strong signals
Warning Alerts: Early signal notifications
Custom Alert Messages: Clear, descriptive alert texts
Multiple Timeframe Compatibility: Works across all timeframes
Risk Management Features
10. Built-in Protection Mechanisms
Signal Confirmation: Prevents false signals
Exit Triggers: Multiple exit conditions
Position Duration Limits: Automatic exit after prolonged periods
Profit/Loss Tracking: Real-time performance monitoring
Volatility Adjustment: Adapts to market conditions
Technical Specifications
11. Performance Optimization
Efficient Calculation: Optimized for real-time performance
Multi-Timeframe Support: Works on all chart timeframes
Resource Management: Controlled line and label counts
Precision Control: Adjustable decimal precision
12. Compatibility
Cryptocurrency Focus: Specifically designed for crypto markets
Multi-Asset Support: Works with all TradingView symbols
Platform Compatibility: Fully compatible with TradingView platform
Mobile Support: Responsive design for mobile devices
Usage Benefits
Comprehensive Analysis: Single indicator providing multiple insights
Clear Signals: Easy-to-understand buy/sell indications
Customizable: Adaptable to different trading styles
Risk-Aware: Built-in risk management features
Professional Grade: Institutional-level analysis tools
User-Friendly: Intuitive visual interface
Educational: Helps understand market sentiment dynamics
This indicator is designed to provide traders with a comprehensive market sentiment analysis tool specifically optimized for cryptocurrency markets, combining traditional technical analysis with crypto-specific metrics.

Overnight Time Box Overnight Time Box (22:59 → 09:59, minutes & TZ)
Automatically draws a time-based box for a customizable window that can cross midnight. Perfect for marking the overnight range up to London open (e.g., 22:59–09:59 in Europe/Bucharest), but works with any minute-level window.
What it does
Builds a daily box covering all price action between two user-defined times (e.g., 22:59 → 09:59).
Tracks session High/Low in real time and can plot extended HL lines for reference.
Keeps historical boxes on the chart for backtesting and review (no flicker, no errors).
How to use
Add the script to an intraday chart.
Configure:
Time zone (default: Europe/Bucharest).
Interval (HHMM-HHMM) — e.g., 2259-0959 (minutes supported).
Optional: High/Low lines, fill color, border color, line width.
Use on intraday timeframes (M1–H4).
Note: On Daily/Weekly/Monthly, a heads-up label reminds you it’s designed for intraday use.
Inputs
Time zone: correct DST handling.
Interval (HHMM-HHMM): supports windows that span midnight.
Draw High/Low lines: extended HL guides for the session.
Colors & widths: full visual customization.
Use cases
Mark the overnight range into London open (10:00 RO).
Delimit Killzones / ICT Silver Bullet windows.
Study range, liquidity raids, FVGs before major sessions.
Tech notes
Built on Pine Script v5 using input.session → stable, DST-safe.
Increased max_boxes_count / max_lines_count to preserve history.
Boxes are “frozen” at session end and remain on chart.
Limitations
Intended for intraday only.
One interval per script instance; attach multiple instances for multiple windows.

NSR - Dynamic Linear Regression ChannelOverview
The NSR - Dynamic Linear Regression Channel is a powerful overlay indicator that plots a dynamic regression-based channel around price action. Unlike static channels, this tool continuously recalculates the linear regression trendline from a user-defined starting point and builds upper and lower boundaries using a combination of standard deviation and maximum price deviations (highs/lows).
It visually separates "Premium" (overvalued) and "Discount" (undervalued) zones relative to the regression trend — ideal for mean-reversion, breakout, or trend-following strategies.
Key Features
Dynamic Regression Line Calculates slope, intercept, and average using full lookback from a reset point.
Adaptive Channel Width Combines standard deviation of residuals with max high/low deviations for robust boundaries.
Auto-Reset on Breakout Channel resets when price closes beyond upper/lower band twice in direction of trend .
Visual Zones Blue shaded = Premium (resistance zone)
Red shaded = Discount (support zone)
Real-Time Updates Live channel extends with each bar; historical channels preserved on reset.
How It Works
Regression Calculation
Uses all bars since last reset to compute the best-fit line:
y = intercept + slope × bar_position
Deviation Bands
Statistical : Standard deviation of price from regression line
Structural : Maximum distance from highs to line (upper) and lows to line (lower)
Final band = Regression Line ± (Deviation Input × StdDev)
Channel Reset Logic
Resets when:
Price closes above upper band twice in an uptrend (slope > 0)
OR closes below lower band twice in a downtrend (slope < 0)
Prevents overextension and adapts to new trends.
Visual Output
Active channel updates in real-time
Completed channels saved as historical reference (up to 500 lines/boxes)
Input Parameters
Deviation (2.0) - Multiplier for standard deviation to set channel width
Premium Color - blue color for upper (resistance) zone
Discount Color - red color for lower (support) zone
Best Use Cases
Mean Reversion - Buy near lower band in uptrend, sell near upper band
Breakout Trading - Enter on confirmed close beyond band + volume
Trend Confirmation - Use slope direction + price position in channel
Stop Loss / Take Profit - Place stops beyond opposite band
Pro Tips
Use on higher timeframes (4H, Daily) for cleaner regression fits
Combine with volume or momentum to filter false breakouts
Lower Deviation (e.g., 1.5) for tighter, more responsive channels
Watch channel resets — they often mark significant trend shifts
Why Use DLRC?
"Most channels are static. This one evolves with the market."
The NSR-DLRC gives you a mathematically sound, visually intuitive way to see:
Where price should be (regression)
Where it has been (deviation extremes)
When the trend is breaking structure
Perfect for traders who want regression-based precision without rigid assumptions.
Add to chart → Watch price dance within the evolving trend corridor.

MIG and MC 发布简介(中文)
MIG and MC 指标帮助日内交易者快速识别微型缺口(Micro Gap)与微型通道(Micro Channel)。脚本支持过滤开盘跳空、合并连续缺口,并自动绘制
FPL(Fair Price Line)延伸线,既可追踪缺口是否被填补,也能直观标注潜在的趋势结构。为了确保跨周期一致性,最新版本对开盘前后和跨日场景做了专门处理
主要特性
- 自动检测并显示看涨/看跌微型缺口,支持按需合并连续缺口。
- 自定义是否忽略开盘缺口、缺口显示范围与 FPL 样式。
- FPL 触及后即停止延伸,辅助研判缺口是否真正回补。
- 内置强收盘与缺口过滤的微型通道识别,可选多种严格程度。
- 适用于 1/5/9 分钟等日内周期,也适用于更长周期。
Recommended English Description
The MIG and MC indicator highlights Micro Gaps and Micro Channels so you can track true intraday imbalances without noise. It merges
consecutive gaps, projects Fair Price Lines (FPL) that stop once touched, and offers a full intraday-ready opening-gap filter so your
early bars stay clean. The latest update refines cross-session handling, giving reliable gap plots on 1-, 5-, and 9-minute charts as well as higher time frames.
Key Features
- Detects bullish and bearish micro gaps with optional gap merging.
- Toggle opening-gap filters and configure look back, visibility, and FPL style.
- FPL lines stop as soon as price revisits the gap, making gap closure obvious.
- Micro Channel mode uses strong-close and gap filters to mark high-quality trend legs.
- Consistent behavior across intraday and higher time frames.

Volume Cluster Support and Resistance Levels [QuantAlgo]🟢 Overview
This indicator identifies statistically significant support and resistance levels through volume cluster analysis, isolating price zones characterized by elevated trading activity and institutional participation. By quantifying areas where volume concentration exceeded historical norms, it reveals price levels with demonstrated supply-demand imbalances that exhibit persistent influence on subsequent price action. The methodology is asset-agnostic and timeframe-independent, applicable across equities, cryptocurrencies, forex, and commodities from intraday to weekly intervals.
🟢 Key Features
1. Support and Resistance Levels
The indicator scans historical price data to identify bars where volume exceeds a user-defined threshold multiplier relative to the rolling average. For each qualifying bar, a representative price is calculated using the average of high, low, and close. Proximate price levels within a specified percentage range are then aggregated into discrete clusters using volume-weighted averaging, eliminating redundant signals. Clusters are ranked by cumulative volume to determine statistical significance. Finally, the indicator plots horizontal levels at each cluster price: support levels (green) below current price indicate zones where historical buying pressure exceeded selling pressure, while resistance levels (red) above current price mark zones where sellers historically dominated. These levels represent areas of established liquidity and price discovery, where institutional order flow previously concentrated.
The Touch Count (T) metric quantifies historical price interaction frequency, while Total Volume (TV) measures aggregate trading activity at each level, providing objective criteria for assessing level strength and trade execution decisions.
2. Volume Histogram
A histogram appears below the price chart, displaying relative volume for each bar within the lookback period, with bar height scaled to the maximum volume observed. Green bars represent up-periods (close > open) indicating buying pressure, while red bars show down-periods (close < open) indicating selling pressure. This visualization helps you confirm the validity of support/resistance levels by seeing where volume actually spiked, identify accumulation/distribution patterns, and validate breakouts by checking if they occur on above-average volume.
3. Built-in Alerts
Automated alerts trigger when price crosses below support levels or breaks above resistance levels, allowing you to monitor multiple assets without constant chart-watching.
4. Customizable Color Schemes
The indicator provides four preset color configurations (Classic, Aqua, Cosmic, Custom) optimized for visual clarity across different charting environments. Each scheme maintains consistent color mapping for support and resistance zones across both level lines and volume histogram components. The Custom configuration permits full color specification to accommodate individual charting setups, ensuring optimal visual contrast for extended analysis sessions.
Classic:
Aqua:
Cosmic:
Custom:
🟢 Pro Tips
→ Trade entry optimization: Execute long positions at support levels with high touch counts or upon confirmed resistance breakouts accompanied by above-average volume
→ Risk parameter definition: Position stop-loss orders near identified support/resistance zones with statistical significance to minimize premature exits
→ Breakout validation: Require volume confirmation exceeding historical average when price penetrates resistance to filter false breakouts
→ Level strength assessment: Prioritize levels with higher touch counts and total volume metrics for enhanced probability trade setups
→ Multi-timeframe confluence: Synthesize support/resistance levels across multiple timeframes to identify high-conviction zones where daily support aligns with 4-hour resistance structures

Value TrailingValue Trailing is a variation of my "Dynamic Trailing" indicator, which had additional features including a band-system that tracks the highs and lows of the past X candles. Value Trailing, on the other hand, uses a default lookback window of 14, and a normal range of 68%, simulating a Fixed Range Volume Profile distribution of the past 14 candles, with bands at the upper and lower 68% range.
This lets the user clearly see the key levels, ignoring potential noise from varying and inconsistent highs and lows, while still allowing the user to trade this alongside basic strategies and concepts such as supply/demand and sideways trends.
This indicator comes with 2 customizable sets of "bands", as well as boxes that identify the range of the last candle that touched one side of the bands.


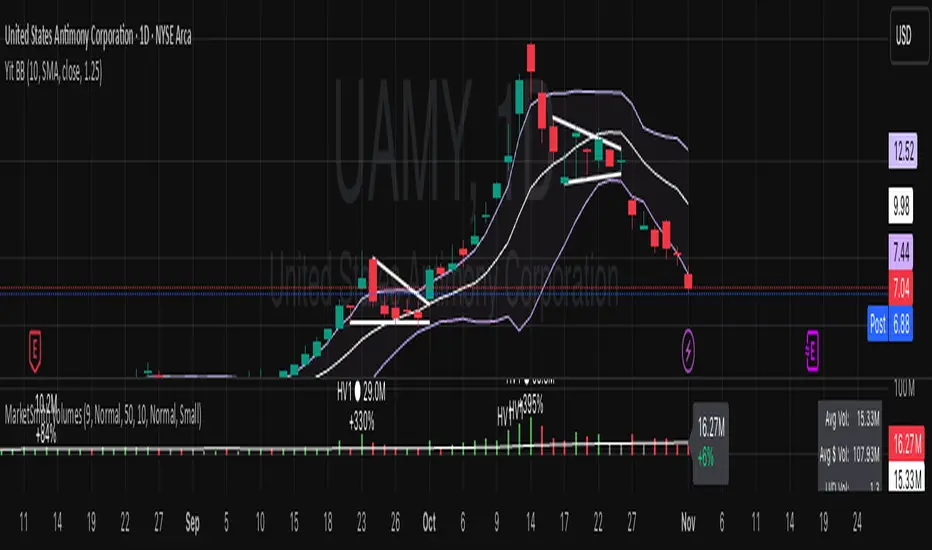
Yit BBIn this script the deviation is 1.25 the normal standard issue Bollinger band indicator uses 2. for my type of trading I don't have time price action to wait for a 2 STDRD DEV. this is a more aggressive type of indicator.
The MA is the 10 day.
HIT Trend & CrossoverThis indicator displays the trend of a declining stock using two yellow trendlines, and when a trend reversal occurs, it marks the buy price with a green trendline and the stop-loss price with a red trendline.
Investors can use these four trendlines as a reference to generate their own profits.

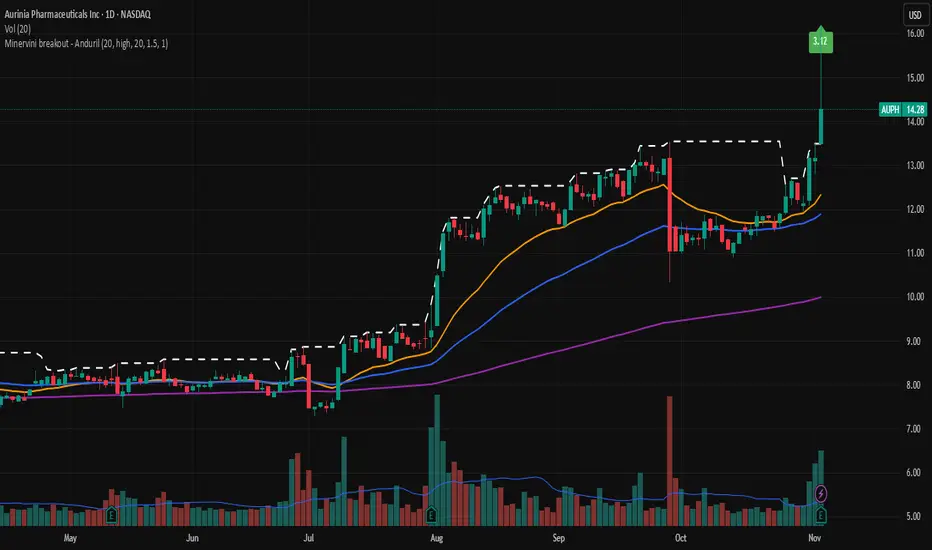
Minervini breakout - AndurilThis indicator checks the Mark Minerivini trend template as well checks consolidation areas and breakout.
Checks the highest closing price of last x days (default 20 days), exluding current day and draws a white dashed line, Calculates the relative volume of the current day. Calculates EMA 21, EMA50 and EMA200 and draws on the graph to define trend.
Gives a buy signal in green (writing relative strength of that day inside of green arrow) if:
1) Current price> breakout price* 0.98
2) Current price > EMA21 >EMA50>EMA200
3) Current price > 52 week high*0.75
4) Current price > 52 week low*1.3
5) EMA 200 of today > EMA 200 of 10 bar ago > EMA 200 of 20 bar ago
6) Relative volume of the day > 1.5
Structure Pro by MurshidfxInspired by the 'mentfx Structure' indicator created by Anton (mentfx) on TradingView,
## Overview
Structure Pro tracks market structure by maintaining an adaptive dealing range and its midpoint. Swing highs and lows become structural boundaries, and the script responds to confirmed breakouts by recalculating the active range. Labels highlight the latest trend flip so the chart stays readable while the range evolves.
## Core Logic
- Detects swing highs/lows using a configurable pivot strength and promotes confirmed pivots to structural levels.
- Applies a percentage buffer to decide when price truly breaks structure; once triggered, the opposite boundary is recalculated with an anchor search that looks back through historical bars.
- Computes equilibrium as the midpoint between the current structural high and low so you can gauge premium versus discount zones.
- Emits a single BULL or BEAR label when the trend state changes, keeping only the most recent signal on the chart.
## How to Use
1. Open a clean chart and apply only this script.
2. Select a swing strength that matches the scale you want to monitor (lower values for responsive intraday swings, higher values for broader moves).
3. Tune the structure sensitivity percentage if you prefer tighter or looser confirmation before declaring a breakout.
4. Track DRH/DRL for the current dealing range, use the equilibrium line as a mean-reversion guide, and look to the BULL/BEAR label for structure confirmation.
5. Combine the levels with your own execution, risk, and position rules—this script does not manage orders.
## Inputs
- Swing Point Strength: bars required on both sides to confirm a pivot.
- Structure Break Sensitivity: percentage buffer applied to the range before calling a breakout.
- Dealing Range display: toggles for visibility, line width/color, label text, and label size.
- Equilibrium display: line style, width, and color controls.
- Trend Signals: enable/disable labels, adjust text size, and pick label colors.
## Notes
- Designed for live structure tracking; the script relies on confirmed pivots and does not peek into future data.
- Built to be chart-agnostic for standard candles; non-standard chart types can distort the measurements.
- Published open-source so traders can review and verify the implementation details.

Breakout line - AndurilThis line shows the highest daily closing price of last 20 days default (can be adjusted from the settings). to help you to understand consolidation points and breakouts.

R Dominant Range [CRT] by Sergi SernaR Dominant Range identifies the most influential R range located to the left of the current price action. It highlights the dominant zone that still impacts market behavior, helping traders understand which range is controlling the current structure.

BB_4_in_1Bollinger Bands (4 in 1)
BB_4_in_1 is a multi-timeframe Bollinger Bands indicator that displays four different sets of Bollinger Bands on the price chart with customizable periods, line styles, and transparency levels. And just to simplify the process of applying indicators, + space saving.
Features:
- Four Bollinger Bands sets: bb_1 (20), bb_2 (80), bb_3 (160), bb_4 (320)
- Customizable period and multiplier for each set
- Unique line styles: standard, stepline, and stepline_diamond
- Adjustable line transparency for better visibility
- No fill between bands for cleaner chart layout
Ideal for multi-timeframe analysis, volatility assessment, and support/resistance level identification.

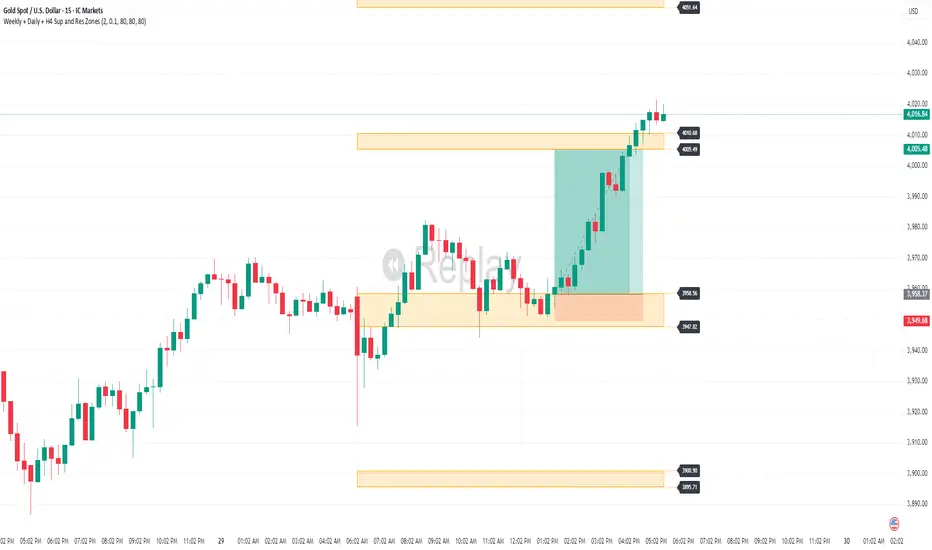
Weekly + Daily + H4 Sup and Res ZonesEveryday price move at a set range. Just wait at the zone for candle reversal/continuation pattern formation before entry. Always keep it simple. Patience is key. Just Pick your preferred tf zone. Daily zone highly recommended for less than 100 pips target. H4 for scalpers and Weekly for swingers.
HEK Dinamik Fiyat Kanalı Stratejisi v1HEK Dynamic Price Channel Strategy
Concept
The HEK Dynamic Price Channel provides a channel structure that expands and contracts according to price momentum and time-based equilibrium.
Unlike fixed-band systems, it evaluates the interaction between price and its balance line through an adaptive channel width that dynamically adjusts to changing market conditions.
How It Works
When the price reacts to the midline, the channel bands automatically reposition themselves.
Touching the upper band indicates a strengthening trend, while touching the lower band signals weakening momentum.
This adaptive mechanism helps filter out false signals during sudden directional changes, enhancing overall signal quality.
Advantages
✅ Maintains trend continuity while avoiding overtrading.
✅ Automatically adapts to changing volatility conditions.
✅ Detects early signals of short- and mid-term trend reversals.
Applications
Directional confirmation in spot and futures markets.
A supporting tool in channel breakout strategies.
Identifying price consolidation and equilibrium zones.
Note
This strategy is intended for educational and research purposes only.
It should not be considered financial advice. Always consult a professional financial advisor before making investment decisions.
© HEK — Adaptive Channel Approach on Dynamic Market Structures
6 gün önce
Sürüm Notları
HEK Dynamic Price Channel Strategy
Concept
The HEK Dynamic Price Channel provides a channel structure that expands and contracts according to price momentum and time-based equilibrium.
Unlike fixed-band systems, it evaluates the interaction between price and its balance line through an adaptive channel width that dynamically adjusts to changing market conditions.
How It Works
When the price reacts to the midline, the channel bands automatically reposition themselves.
Touching the upper band indicates a strengthening trend, while touching the lower band signals weakening momentum.
This adaptive mechanism helps filter out false signals during sudden directional changes, enhancing overall signal quality.
Advantages
✅ Maintains trend continuity while avoiding overtrading.
✅ Automatically adapts to changing volatility conditions.
✅ Detects early signals of short- and mid-term trend reversals.
Applications
Directional confirmation in spot and futures markets.
A supporting tool in channel breakout strategies.
Identifying price consolidation and equilibrium zones.
Note
This strategy is intended for educational and research purposes only.
It should not be considered financial advice. Always consult a professional financial advisor before making investment decisions.
© HEK — Adaptive Channel Approach on Dynamic Market Structures

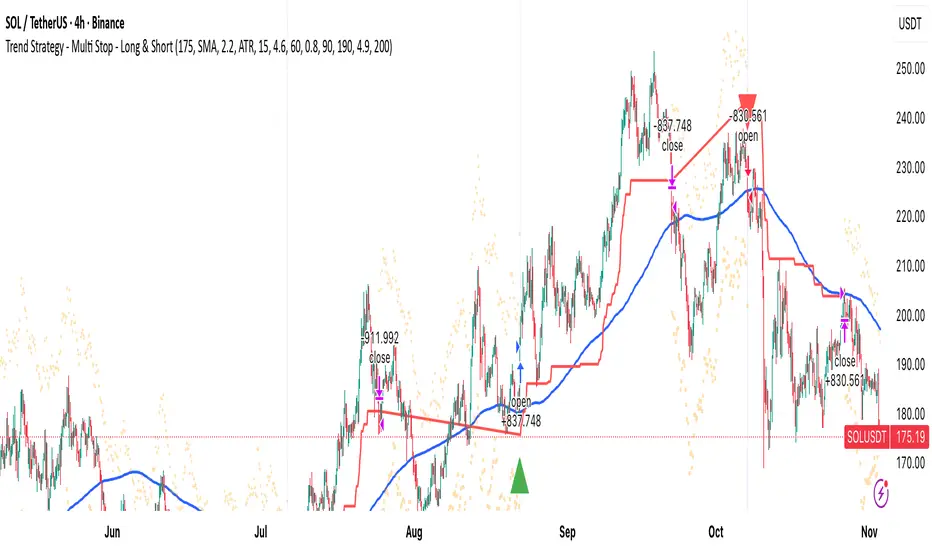
MA Break Trend Strategy - Multi Stop MethodsThis is a trend-following trading strategy with multiple stop loss options for both long and short positions.
Entry Signal: Trades are triggered when price crosses above (long) or below (short) a configurable moving average (EMA or SMA, default 200-period)
Volume Confirmation: Optional filter requiring volume to exceed a multiplier (default 1.5x) of the 20-period volume average before entering trades
Five Stop Loss Methods:
- ATR-based: Dynamic stop using Average True Range multiplier below/above entry price
- MA Buffer: Stop set at a percentage offset from a separate moving average (default 50-period EMA)
- Donchian Channel: Uses the lowest low/highest high over a specified lookback period
- Keltner Channel: ATR-based bands around an EMA basis
- Lowest Low/Highest High: Simple swing point stops based on recent price extremes
- Trailing Stops: All stop methods automatically trail in the profitable direction (upward for longs, downward for shorts) to lock in gains while never moving against the position
Visual Indicators:
- Plots the trend-following moving average in blue
- Shows active stop loss levels in red when in a position
- Displays reference lines for all stop types when flat
- Entry signals marked with triangles (green up for long, red down for short)
- Background highlighting for volume-confirmed crossovers
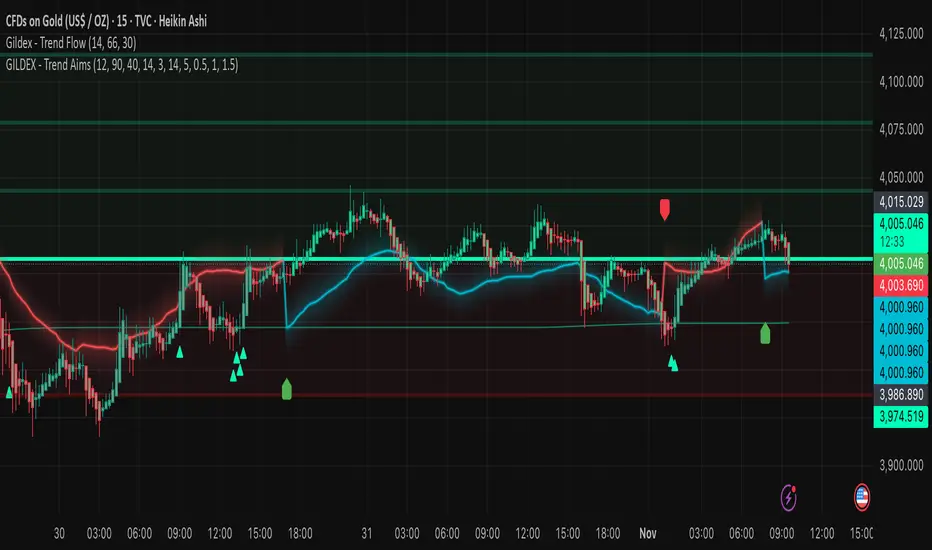
Marshall Gold Spot SignalsPrediction of How It Will Behave (Live on Chart)
✅ Bullish Scenario (Uptrend Prediction)
If price:
Drops near or below the lower Bollinger Band
Then crosses above the SMA(20)
→ You’ll get a "BUY" label right below the candle.
🟢 What happens:
If trend continues up, SMA(20) moves above SMA(50)
Price trades between middle and upper BB
Potential continuation pattern
Confidence: High in sideways-to-uptrend markets
Target levels: Middle-to-upper BB
❌ Bearish Scenario (Downtrend Prediction)
If price:
Spikes near upper BB
Then crosses below the SMA(20)
→ You’ll get a "SELL" label above the candle.
🔻 What happens:
Price typically moves toward middle/lower BB
Possible SMA(20) < SMA(50) cross
Trendline drawn downward
Confidence: Strong in overbought markets
Target levels: BB Basis or BB Lower
🤔 Consolidation / Chop Zone
When:
Price stays between SMA(20) and SMA(50)
BB bands are tight
⚠️ You might get false signals back and forth (whipsaw)
Tip: Add RSI or trend filter to reduce noise
📊 Realistic Performance Expectations
Market Condition Signal Quality Best Use
Strong Trend ✅ High Trend-following entries
Ranging Market ⚠️ Medium to Low Better with filters (e.g. RSI)
Volatile Breaks ✅ Good with BB Volatility squeeze detection

KeyzoneKeyzone is a dynamic support and resistance framework that identifies price reaction zones using the highest and lowest values over specific lookback periods.
It consists of four pairs of upper and lower lines:
– Keyzone 3 (light green): short-term micro swing zones
– Keyzone 8 (dark green): short-term intraday zones
– Keyzone 21 (orange): medium-term structural zones
– Keyzone 89 (red): long-term major zones
Each Keyzone adapts automatically to price movement, helping traders see where market participants are likely to react. The shorter zones (3, 8) capture quick pullbacks, while the longer zones (21, 89) reveal deeper institutional levels. This makes Keyzone a clear, multi-layered visual map of market structure that adjusts with every new candle.

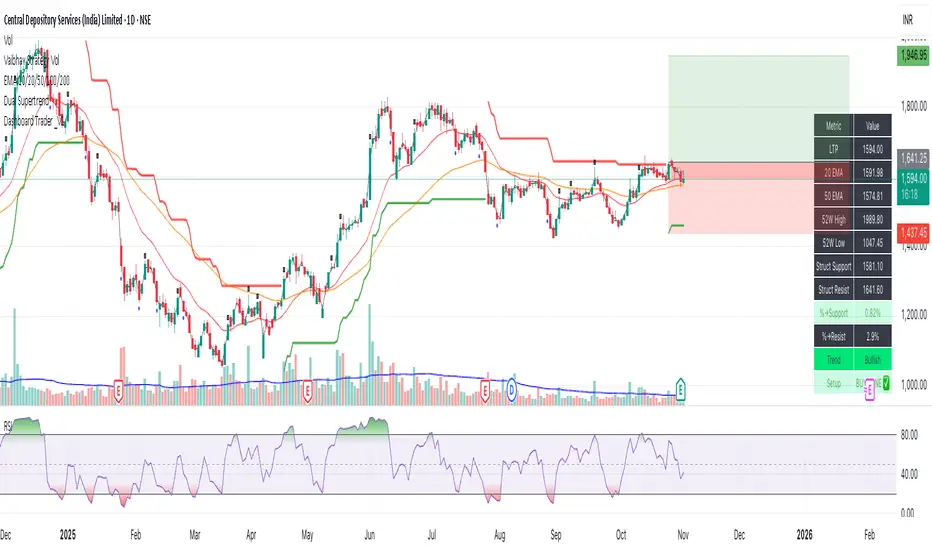
Dashboard Trader _V1
📊 Dashboard Trader – Adaptive Structure, Trend & Zones
Description:
NSE Dashboard V3 is a next-gen support–resistance and trend-mapping indicator designed for positional and swing traders. It combines price structure, moving averages, and adaptive pivot logic to highlight Buy Zones, Take-Profit Zones, and overall market direction — all inside a clean, compact dashboard.
⸻
🧩 What It Does
• Auto-detects structural support & resistance zones using adaptive pivot clustering logic.
• Tracks broken levels dynamically — old supports removed, new ones added.
• Identifies trend bias using dual EMAs (20-EMA & 50-EMA).
• Displays a live dashboard table showing:
• LTP (Last Traded Price)
• 20 EMA / 50 EMA
• 52-week High & Low (true daily data)
• Structural Support & Resistance
• % Distance to each zone
• Trend direction
• Trade Setup Zone → BUY ✅ / TAKE PROFIT ⚠ / NEUTRAL
⸻
🧠 How to Trade It
1. Check the trend:
• 20 EMA > 50 EMA → Bullish bias (look for long entries).
• 20 EMA < 50 EMA → Bearish bias (look for short or avoid longs).
2. Enter near support:
• When price is ≤ 2% above Struct Support and trend is bullish → BUY ZONE ✅
3. Exit or reduce near resistance:
• When price is ≤ 2% below Struct Resistance → TAKE PROFIT ⚠
4. If no valid resistance (at ATH):
• Trail stop below 20 EMA or last swing low.
⸻
⚙️ Key Features
• EMA-based trend detection
• Dynamic structural zone calculation (auto-updates)
• Daily timeframe 52-week High/Low
• Auto color-coded zones and table
• Works on all NSE stocks, futures, or indices
• Optional refresh every new bar
• Lightweight – optimized for live chart use
⸻
📈 Best Used For
• Swing trading / Positional setups (Daily or 4-hour charts)
• Intraday confirmation on lower timeframes (15-min+)
• Trend continuation entries and risk-defined reversals
⸻
⚠️ Disclaimer
This indicator is for educational purposes only.
It does not constitute financial advice or a buy/sell recommendation.
Always combine with your own price action, volume, and risk management.
⸻
💬 Author’s Note
Built for traders who think in zones, not signals.
Trade where risk is smallest and structure is strongest.
— Wealthcafe Investments