Helix Protocol 7Helix Protocol 7
Overview
Helix Protocol 7 is a trend-adaptive signal engine that automatically adjusts its buy and sell criteria based on current market conditions. Rather than using fixed thresholds that work well in some environments but fail in others, Helix detects whether the market is in a strong uptrend, neutral consolidation, or downtrend, then applies the appropriate signal parameters for each state. This adaptive approach helps traders buy dips aggressively in confirmed uptrends while requiring much stricter conditions before buying in downtrends.
Core Philosophy
The fundamental insight behind Helix is that the same indicator readings mean different things in different market contexts. An RSI of 45 during a strong uptrend represents a healthy pullback and buying opportunity. That same RSI of 45 during a confirmed downtrend might just be a brief pause before further decline. Helix encodes this context-awareness directly into its signal logic.
The Money Line
At the center of the indicator is the Money Line, which can be configured as either a linear regression line or a weighted combination of exponential moving averages. Linear regression provides a mathematically optimal fit through recent price data, while the weighted EMA option offers more responsiveness to recent price action. The slope of the Money Line determines whether the immediate price trend is bullish, bearish, or neutral, which affects the color of the bands and cloud shading.
Dynamic Envelope Bands
Upper and lower bands are calculated using Average True Range multiplied by a dynamic factor. When ADX indicates trending conditions, the bands automatically widen to accommodate larger price swings. The Chaikin Accumulation/Distribution indicator also influences band width, with strong accumulation or distribution causing additional band expansion. This dual adaptation helps the bands remain relevant across different volatility regimes.
Trend State Detection
Helix classifies market conditions into four distinct states using a combination of ADX behavior and Directional Movement analysis.
Strong Uptrend requires ADX to be rising (gaining momentum), ADX value above a threshold (default 25), and the positive directional indicator exceeding the negative. This combination confirms not just that price is rising, but that the trend is strengthening.
Strong Downtrend uses the same ADX requirements but with the negative directional indicator dominant. This identifies accelerating downward momentum.
Weak Downtrend is detected when ADX is falling (trend losing steam) but negative DI still exceeds positive DI. This often represents the exhaustion phase of a decline.
Neutral applies when none of the above conditions are met, typically during consolidation or when directional indicators are close together.
Adaptive Signal Thresholds
The indicator uses Fisher Transform and RSI as its primary oscillators, but the trigger levels change based on trend state.
During Strong Uptrend, buy conditions are relaxed significantly. The Fisher threshold might be set to 1.0 (only slightly below neutral) and RSI to 50, allowing entries on minor pullbacks within the established trend. Sell conditions are tightened, requiring Fisher above 2.5 and RSI above 70, letting winning positions run longer.
During Neutral conditions, both buy and sell thresholds return to traditional oversold and overbought levels. Fisher must reach -2.0 for buys and +2.0 for sells, with RSI requirements around 30 and 65 respectively.
During Downtrend, buy conditions become very strict. Fisher must reach extreme oversold levels like -2.5 and RSI must drop below 25, ensuring buys only trigger on genuine capitulation. Sell conditions are loosened, allowing exits on any meaningful bounce.
This asymmetric approach embodies the trading principle of being aggressive when conditions favor you and defensive when they do not.
Band Touch Signals
In addition to oscillator-based signals, Helix generates signals when price touches the dynamic bands. A touch of the lower band indicates potential support and generates a buy signal. A touch of the upper band suggests potential resistance and generates a sell signal. These band-based signals work alongside the oscillator signals, providing entries even when Fisher and RSI have not reached their thresholds.
Extreme Move Detection
Sometimes price moves so violently that it penetrates the bands by an unusual amount. Helix measures this penetration depth as a percentage of ATR and can flag these as "extreme" signals. Extreme signals have special properties: they can fire intra-bar (before the candle closes) to catch wick entries, they can bypass normal cooldown periods, and they can optionally bypass volatility freezes. This allows the indicator to capture panic selling events that might be missed by waiting for candle closes.
Cascade Protection System
A critical feature for risk management is the built-in cascade protection that prevents averaging down into oblivion. The system has two components.
First, it tracks Bollinger Band Width Percentile, which measures current volatility relative to its historical range. When BBWP exceeds a threshold (default 92%), indicating a volatility spike often associated with sharp directional moves, all buy signals are temporarily frozen. This prevents entries during the most dangerous market conditions.
Second, it counts consecutive buy signals without an intervening sell. After reaching the maximum (default 3), no additional buy signals are generated until a sell occurs. This absolute limit prevents the common mistake of repeatedly buying a falling asset.
The protection status is displayed in the information panel, showing current BBWP level and the consecutive buy count.
RSI Divergence Detection
Helix includes automatic detection of RSI divergences, which often precede trend reversals. Regular bullish divergence occurs when price makes a lower low but RSI makes a higher low, suggesting weakening downside momentum. Regular bearish divergence is the opposite pattern at tops. Hidden divergences, which suggest trend continuation rather than reversal, are also detected and can be displayed optionally. Divergence lines are drawn directly on the price chart connecting the relevant pivot points.
Signal Cooldown
To prevent signal clustering and overtrading, a configurable cooldown period prevents new signals for a set number of bars after each signal. This ensures each signal represents a distinct trading opportunity.
Visual Components
The indicator provides comprehensive visual feedback. The Money Line changes color based on slope direction. The cloud shading between bands reflects trend bias. An ADX bar at the bottom of the chart uses color coding to show trend state at a glance: lime for strong uptrend, red for downtrend, white for ranging (very low ADX), orange for flat, and blue for trending but not yet strong.
Price labels appear at signal locations showing the entry or exit price, the trigger type (band touch, uptrend dip, capitulation, etc.), and the current position in the consecutive buy count.
The information panel displays current trend state, divergence status, BBWP freeze status, buy counter, ADX with direction arrow, DI spread, Fisher and RSI values, and the current active thresholds for buy and sell signals. A compact mode is available for mobile devices.
How to Use
In strong uptrends, look for buy signals on pullbacks to the Money Line or lower band. The relaxed thresholds will generate more frequent entries, which is appropriate when trend momentum is confirmed. Consider letting sell signals pass if the trend remains strong.
In neutral markets, treat signals more selectively. Both buy and sell signals require significant oscillator extremes, making them higher-probability but less frequent.
In downtrends, exercise extreme caution with buy signals. The strict requirements mean buys only trigger on major oversold conditions. Respect sell signals promptly, as the loosened thresholds are designed to protect capital.
Always monitor the cascade protection status. If BBWP shows frozen or the buy counter is at maximum, the indicator is warning you that conditions are dangerous for new long entries.
Settings Guidance
The default settings are calibrated for cryptocurrency markets on 5-minute timeframes. For other assets or timeframes, consider adjusting the ADX threshold for strong trend detection (lower for less volatile assets), the Fisher and RSI thresholds for each trend state, and the BBWP freeze level based on the asset's typical volatility profile.
The indicator includes a debug panel that can be enabled to show the detailed state of all conditions, useful for understanding why signals are or are not firing.
チャートパターン

takeshi_2Step_Screener_MOU_KAKU_FIXED3//@version=5
indicator("MNO_2Step_Screener_MOU_KAKU_FIXED3", overlay=true, max_labels_count=500)
// =========================
// Inputs
// =========================
emaSLen = input.int(5, "EMA Short (5)")
emaMLen = input.int(13, "EMA Mid (13)")
emaLLen = input.int(26, "EMA Long (26)")
macdFast = input.int(12, "MACD Fast")
macdSlow = input.int(26, "MACD Slow")
macdSignal = input.int(9, "MACD Signal")
macdZeroTh = input.float(0.2, "MOU: MACD near-zero threshold", step=0.05)
volLookback = input.int(5, "Volume MA days", minval=1)
volMinRatio = input.float(1.3, "MOU: Volume ratio min", step=0.1)
volStrong = input.float(1.5, "Strong volume ratio (Breakout/KAKU)", step=0.1)
volMaxRatio = input.float(3.0, "Volume ratio max (filter)", step=0.1)
wickBodyMult = input.float(2.0, "Pinbar: lowerWick >= body*x", step=0.1)
pivotLen = input.int(20, "Resistance lookback", minval=5)
pullMinPct = input.float(5.0, "Pullback min (%)", step=0.1)
pullMaxPct = input.float(15.0, "Pullback max (%)", step=0.1)
breakLookbackBars = input.int(5, "Pullback route: valid bars after break", minval=1)
// --- Breakout route (押し目なし初動ブレイク) ---
useBreakoutRoute = input.bool(true, "Enable MOU Breakout Route (no pullback)")
breakConfirmPct = input.float(0.3, "Break confirm: close > R*(1+%)", step=0.1)
bigBodyLookback = input.int(20, "Break candle body MA length", minval=5)
bigBodyMult = input.float(1.2, "Break candle: body >= MA*mult", step=0.1)
requireCloseNearHigh = input.bool(true, "Break candle: close near high")
closeNearHighPct = input.float(25.0, "Close near high threshold (% of range)", step=1.0)
allowMACDAboveZeroInstead = input.bool(true, "Breakout route: allow MACD GC above zero instead")
// 表示
showEMA = input.bool(true, "Plot EMAs")
showMou = input.bool(true, "Show MOU label")
showKaku = input.bool(true, "Show KAKU label")
showDebugTbl = input.bool(false, "Show debug table (last bar)")
locChoice = input.string("Below Bar", "Label location", options= )
lblLoc = locChoice == "Below Bar" ? location.belowbar : location.abovebar
// =========================
// EMA
// =========================
emaS = ta.ema(close, emaSLen)
emaM = ta.ema(close, emaMLen)
emaL = ta.ema(close, emaLLen)
// plot は if の中に入れない(naで制御)
plot(showEMA ? emaS : na, color=color.new(color.yellow, 0), title="EMA 5")
plot(showEMA ? emaM : na, color=color.new(color.blue, 0), title="EMA 13")
plot(showEMA ? emaL : na, color=color.new(color.orange, 0), title="EMA 26")
emaUpS = emaS > emaS
emaUpM = emaM > emaM
emaUpL = emaL > emaL
goldenOrder = emaS > emaM and emaM > emaL
above26_2days = close > emaL and close > emaL
// 勝率維持の土台(緩めない)
baseTrendOK = (emaUpS and emaUpM and emaUpL) and goldenOrder and above26_2days
// =========================
// MACD
// =========================
= ta.macd(close, macdFast, macdSlow, macdSignal)
macdGC = ta.crossover(macdLine, macdSig)
macdUp = macdLine > macdLine
macdNearZero = math.abs(macdLine) <= macdZeroTh
macdGCAboveZero = macdGC and macdLine > 0 and macdSig > 0
macdMouOK = macdGC and macdNearZero and macdUp
macdBreakOK = allowMACDAboveZeroInstead ? (macdMouOK or macdGCAboveZero) : macdMouOK
// =========================
// Volume
// =========================
volMA = ta.sma(volume, volLookback)
volRatio = volMA > 0 ? (volume / volMA) : na
volumeMouOK = volRatio >= volMinRatio and volRatio <= volMaxRatio
volumeStrongOK = volRatio >= volStrong and volRatio <= volMaxRatio
// =========================
// Candle patterns
// =========================
body = math.abs(close - open)
upperWick = high - math.max(open, close)
lowerWick = math.min(open, close) - low
pinbar = (lowerWick >= wickBodyMult * body) and (lowerWick > upperWick) and (close >= open)
bullEngulf =
close > open and close < open and
close >= open and open <= close
bigBull =
close > open and
open < emaM and close > emaS and
(body > ta.sma(body, 20))
candleOK = pinbar or bullEngulf or bigBull
// =========================
// Resistance / Pullback route
// =========================
res = ta.highest(high, pivotLen)
pullbackPct = res > 0 ? (res - close) / res * 100.0 : na
pullbackOK = pullbackPct >= pullMinPct and pullbackPct <= pullMaxPct
brokeRes = ta.crossover(close, res )
barsSinceBreak = ta.barssince(brokeRes)
afterBreakZone = (barsSinceBreak >= 0) and (barsSinceBreak <= breakLookbackBars)
pullbackRouteOK = afterBreakZone and pullbackOK
// =========================
// Breakout route (押し目なし初動ブレイク)
// =========================
breakConfirm = close > res * (1.0 + breakConfirmPct / 100.0)
bullBreak = close > open
bodyMA = ta.sma(body, bigBodyLookback)
bigBodyOK = bodyMA > 0 ? (body >= bodyMA * bigBodyMult) : false
rng = math.max(high - low, syminfo.mintick)
closeNearHighOK = not requireCloseNearHigh ? true : ((high - close) / rng * 100.0 <= closeNearHighPct)
mou_breakout =
useBreakoutRoute and
baseTrendOK and
breakConfirm and
bullBreak and
bigBodyOK and
closeNearHighOK and
volumeStrongOK and
macdBreakOK
mou_pullback = baseTrendOK and volumeMouOK and candleOK and macdMouOK and pullbackRouteOK
mou = mou_pullback or mou_breakout
// =========================
// KAKU (Strict): 8条件 + 最終三点
// =========================
cond1 = emaUpS and emaUpM and emaUpL
cond2 = goldenOrder
cond3 = above26_2days
cond4 = macdGCAboveZero
cond5 = volumeMouOK
cond6 = candleOK
cond7 = pullbackOK
cond8 = pullbackRouteOK
all8_strict = cond1 and cond2 and cond3 and cond4 and cond5 and cond6 and cond7 and cond8
final3 = pinbar and macdGCAboveZero and volumeStrongOK
kaku = all8_strict and final3
// =========================
// Display (統一ラベル)
// =========================
showKakuNow = showKaku and kaku
showMouPull = showMou and mou_pullback and not kaku
showMouBrk = showMou and mou_breakout and not kaku
plotshape(showMouPull, title="MOU_PULLBACK", style=shape.labelup, text="猛",
color=color.new(color.lime, 0), textcolor=color.black, location=lblLoc, size=size.tiny)
plotshape(showMouBrk, title="MOU_BREAKOUT", style=shape.labelup, text="猛B",
color=color.new(color.lime, 0), textcolor=color.black, location=lblLoc, size=size.tiny)
plotshape(showKakuNow, title="KAKU", style=shape.labelup, text="確",
color=color.new(color.yellow, 0), textcolor=color.black, location=lblLoc, size=size.small)
// =========================
// Alerts
// =========================
alertcondition(mou, title="MNO_MOU", message="MNO: MOU triggered")
alertcondition(mou_breakout, title="MNO_MOU_BREAKOUT", message="MNO: MOU Breakout triggered")
alertcondition(mou_pullback, title="MNO_MOU_PULLBACK", message="MNO: MOU Pullback triggered")
alertcondition(kaku, title="MNO_KAKU", message="MNO: KAKU triggered")
// =========================
// Debug table (optional)
// =========================
var table t = table.new(position.top_right, 2, 14, border_width=1, border_color=color.new(color.white, 60))
fRow(_name, _cond, _r) =>
bg = _cond ? color.new(color.lime, 70) : color.new(color.red, 80)
tx = _cond ? "OK" : "NO"
table.cell(t, 0, _r, _name, text_color=color.white, bgcolor=color.new(color.black, 0))
table.cell(t, 1, _r, tx, text_color=color.white, bgcolor=bg)
if showDebugTbl and barstate.islast
// ❗ colspanは使えないので2セルでヘッダーを作る
table.cell(t, 0, 0, "MNO Debug", text_color=color.white, bgcolor=color.new(color.black, 0))
table.cell(t, 1, 0, "", text_color=color.white, bgcolor=color.new(color.black, 0))
fRow("BaseTrend", baseTrendOK, 1)
fRow("MOU Pullback", mou_pullback, 2)
fRow("MOU Breakout", mou_breakout, 3)
fRow("Break confirm", breakConfirm, 4)
fRow("Break big body", bigBodyOK, 5)
fRow("Break close high", closeNearHighOK, 6)
fRow("Break vol strong", volumeStrongOK, 7)
fRow("Break MACD", macdBreakOK, 8)
fRow("KAKU all8", all8_strict, 9)
fRow("KAKU final3", final3, 10)
fRow("MOU any", mou, 11)
fRow("KAKU", kaku, 12)

ORB + FVG + PDH/PDL ORB + FVG + PDH/PDL is an all-in-one day-trading overlay that plots:
Opening Range (ORB) high/low with optional box and extension
Fair Value Gaps (FVG) with optional “unmitigated” levels + mitigation lines
Previous Day High/Low history (PDH/PDL) drawn as one-day segments (yesterday’s levels plotted across today’s session only)
Includes presets (ORB only / FVG only / Both) and optional alerts for ORB touches, ORB break + retest, FVG entry, and PDH/PDL touches.

DR/IDR Break .5 TPDR/IDR Extension Breakout with Custom Stop
This strategy is a systematic, counter-trend, and momentum-based system designed for intraday trading. It operates on the principle of an Opening Range Breakout (ORB), utilizing the initial market consolidation to project high-probability targets, while offering multiple methods for managing risk.
1. Market Identification (The Opening Range)
The strategy begins by defining the market's initial boundaries and volatility:
Session Window: The strategy calculates the Opening Range (OR) over a user-defined time period (default: 9:30 AM to 10:30 AM New York Time).
ORB Levels: Two key price levels are established and locked once the time window closes:
Wick High/Low: The absolute highest and lowest prices of the session. These serve as the entry trigger lines.
Body High/Low (Shaded Range): The highest and lowest open/close prices of the session. The height of this range is used to calculate the Take Profit and Stop Loss levels.
2. Entry Rule (The Breakout)
The strategy is passive until the range is violated, looking for a strong move out of the consolidation area.
Trigger Condition: A trade is signaled when a candle closes either:
Above the Wick High (for a Long entry).
Below the Wick Low (for a Short entry).
Execution: The entry is a Market Order executed on the candle that meets the trigger condition, subject to a user-defined Entry Delay (default 0 bars, meaning the entry is taken immediately upon the breakout candle's close).
Direction Control: The user can select to trade Long Only, Short Only, or Both.
3. Exit and Risk Management
All trades are placed with simultaneous Take Profit and Stop Loss orders (a bracket order) once the entry is filled.
A. Take Profit (TP)
The Take Profit is set at the 0.5 Extension of the Shaded Range (Body Range).
Calculation: The distance from the Body High/Low to the TP level is exactly 50% of the total height of the Shaded Range.
B. Stop Loss (SL)
The Stop Loss is dynamically calculated based on a user-selected method for risk control:
Range 0.5 (Body Range): The Stop Loss is placed an equal distance (0.5 times the Body Range height) outside the opposite side of the Body Range.
Example (Long): If entry is above the Wick High, the SL is set 0.5 times the Body Range height below the Body Low.
ATR Multiple: The Stop Loss distance is determined by the asset's recent volatility.
Calculation: The distance is calculated as a user-defined Multiplier (default 2.0) times the Average True Range (ATR).
Recent Swing Low/High: The Stop Loss is placed based on a structural level defined by recent price action.
Long Entry: SL is placed at the Lowest Swing Low within a user-defined lookback period.
Short Entry: SL is placed at the Highest Swing High within a user-defined lookback period.
Summary of Workflow
The market sets the Wick and Body boundaries (e.g., 9:30–10:30 AM).
Price breaks and closes beyond a Wick boundary, triggering a signal.
The trade enters after the specified delay.
A bracket order is placed: TP is fixed at the 0.5 Extension, and SL is set based on the user's chosen risk method.
The trade is closed upon reaching either the TP or the SL level.

Fat Tony's Composite Momentum + ROC (v0.4)Fat Tony's Composite Momentum + ROC (v0.4)
Option guy settings and indicators

Multi-MA + RSI Pullback Strategy (Jordan)1️⃣ Strategy logic I’ll code
From your screenshots:
Indicators
• EMAs: 600 / 200 / 100 / 50
• RSI: length 6, levels 80 / 20
Rules (simplified so a script can handle them):
• Use a higher-timeframe trend filter (15m or 1h) using the EMAs.
• Take entries on the chart timeframe (you can use 1m or 5m).
• Long:
• Higher-TF trend is up.
• Price is pulling back into a zone (between 50 EMA and 100 EMA on the entry timeframe – this approximates your 50–61% retrace).
• RSI crosses below 20 (oversold).
• Short:
• Higher-TF trend is down.
• Price pulls back between 50 & 100 EMAs.
• RSI crosses above 80 (overbought).
• Exits: ATR-based stop + take-profit with adjustable R:R (2:1 or 3:1).
• Max 4 trades per day.
News filter & “only trade gold” you handle manually (run it on XAUUSD and avoid news times yourself – TradingView can’t read the economic calendar from code).

Cup & Handle Finder by Mashrab🚀 New Tool Alert: The "Perfect Cup" Finder
Hey everyone! I’ve built a custom indicator to help us find high-quality Cup & Handle setups before they breakout.
Most scripts just look for random highs and lows, but this one uses a geometric algorithm to ensure the base is actually round (avoiding those messy V-shapes).
How it works:
🔵 Blue Arc: This marks a verified, institutional-quality Cup.
🟠 Orange Box: This is the "Handle Zone." If you see this connecting to the current candle, it means the setup is live and ready for a potential entry!
Best Usage:
Works best on Weekly (1W) charts.
It’s designed to be an "Early Warning" system—alerting you while the handle is still forming so you don't miss the move.
Give it a try and let me know what you find! 📉📈

indicator("MouNoOkite_InitialMove_Screener", overlay=true)//@version=5
indicator("猛の掟・初動スクリーナー(5EMA×MACD×出来高×ローソク)", overlay=true, max_labels_count=500)
// =========================
// Inputs
// =========================
emaSLen = input.int(5, "EMA Short (5)")
emaMLen = input.int(13, "EMA Mid (13)")
emaLLen = input.int(26, "EMA Long (26)")
macdFast = input.int(12, "MACD Fast")
macdSlow = input.int(26, "MACD Slow")
macdSignal = input.int(9, "MACD Signal")
volLookback = input.int(5, "出来高平均(日数)", minval=1)
volMinRatio = input.float(1.3, "出来高倍率(初動点灯)", step=0.1)
volStrong = input.float(1.5, "出来高倍率(本物初動)", step=0.1)
volMaxRatio = input.float(2.0, "出来高倍率(上限目安)", step=0.1)
wickBodyMult = input.float(2.0, "ピンバー判定: 下ヒゲ >= (実体×倍率)", step=0.1)
pivotLen = input.int(20, "直近高値/レジスタンス判定のLookback", minval=5)
pullMinPct = input.float(5.0, "押し目最小(%)", step=0.1)
pullMaxPct = input.float(15.0, "押し目最大(%)", step=0.1)
showDebug = input.bool(true, "デバッグ表示(条件チェック)")
// =========================
// EMA
// =========================
emaS = ta.ema(close, emaSLen)
emaM = ta.ema(close, emaMLen)
emaL = ta.ema(close, emaLLen)
plot(emaS, color=color.new(color.yellow, 0), title="EMA 5")
plot(emaM, color=color.new(color.blue, 0), title="EMA 13")
plot(emaL, color=color.new(color.orange, 0), title="EMA 26")
emaUpS = emaS > emaS
emaUpM = emaM > emaM
emaUpL = emaL > emaL
// 26EMA上に2日定着
above26_2days = close > emaL and close > emaL
// 黄金隊列
goldenOrder = emaS > emaM and emaM > emaL
// =========================
// MACD
// =========================
= ta.macd(close, macdFast, macdSlow, macdSignal)
// ヒストグラム縮小(マイナス圏で上向きの準備)も見たい場合の例
histShrinking = math.abs(macdHist) < math.abs(macdHist )
histUp = macdHist > macdHist
// ゼロライン上でGC(最終シグナル)
macdGCAboveZero = ta.crossover(macdLine, macdSig) and macdLine > 0 and macdSig > 0
// 参考:ゼロ直下で上昇方向(勢い準備)
macdRisingNearZero = (macdLine < 0) and (macdLine > macdLine ) and (math.abs(macdLine) <= math.abs(0.5))
// =========================
// Volume
// =========================
volMA = ta.sma(volume, volLookback)
volRatio = volMA > 0 ? (volume / volMA) : na
volumeOK = volRatio >= volMinRatio and volRatio <= volMaxRatio
volumeStrongOK = volRatio >= volStrong
// =========================
// Candle patterns
// =========================
body = math.abs(close - open)
upperWick = high - math.max(open, close)
lowerWick = math.min(open, close) - low
// 長い下ヒゲ(ピンバー系): 実体が小さく、下ヒゲが優位
pinbar = (lowerWick >= wickBodyMult * body) and (lowerWick > upperWick) and (close >= open)
// 陽線包み足(前日陰線を包む)
bullEngulf =
close > open and close < open and
close >= open and open <= close
// 5EMA・13EMA を貫く大陽線(勢い)
bigBull =
close > open and
open < emaM and close > emaS and
(body > ta.sma(body, 20)) // “相対的に大きい”目安
candleOK = pinbar or bullEngulf or bigBull
// =========================
// 押し目 (-5%〜-15%) & レジブレ後
// =========================
recentHigh = ta.highest(high, pivotLen)
pullbackPct = recentHigh > 0 ? (recentHigh - close) / recentHigh * 100.0 : na
pullbackOK = pullbackPct >= pullMinPct and pullbackPct <= pullMaxPct
// “レジスタンスブレイク”簡易定義:直近pivotLen高値を一度上抜いている
// → その後に押し目位置にいる(現在が押し目)
brokeResistance = ta.crossover(close, recentHigh ) or (close > recentHigh )
afterBreakPull = brokeResistance or brokeResistance or brokeResistance or brokeResistance or brokeResistance
breakThenPullOK = afterBreakPull and pullbackOK
// =========================
// 最終三点シグナル(ヒゲ × 出来高 × MACD)
// =========================
final3 = pinbar and macdGCAboveZero and volumeStrongOK
// =========================
// 猛の掟 8条件チェック(1つでも欠けたら「見送り」)
// =========================
// 1) 5EMA↑ 13EMA↑ 26EMA↑
cond1 = emaUpS and emaUpM and emaUpL
// 2) 5>13>26 黄金隊列
cond2 = goldenOrder
// 3) ローソク足が26EMA上に2日定着
cond3 = above26_2days
// 4) MACD(12,26,9) ゼロライン上でGC
cond4 = macdGCAboveZero
// 5) 出来高が直近5日平均の1.3〜2.0倍
cond5 = volumeOK
// 6) ピンバー or 包み足 or 大陽線
cond6 = candleOK
// 7) 押し目 -5〜15%
cond7 = pullbackOK
// 8) レジスタンスブレイク後の押し目
cond8 = breakThenPullOK
all8 = cond1 and cond2 and cond3 and cond4 and cond5 and cond6 and cond7 and cond8
// =========================
// 判定(2択のみ)
// =========================
isBuy = all8 and final3
decision = isBuy ? "買い" : "見送り"
// =========================
// 表示
// =========================
plotshape(isBuy, title="BUY", style=shape.labelup, text="買い", color=color.new(color.lime, 0), textcolor=color.black, location=location.belowbar, size=size.small)
plotshape((not isBuy) and all8, title="ALL8_OK_but_noFinal3", style=shape.labelup, text="8条件OK (最終3未)", color=color.new(color.yellow, 0), textcolor=color.black, location=location.belowbar, size=size.tiny)
// デバッグ(8項目チェック結果)
if showDebug and barstate.islast
var label dbg = na
label.delete(dbg)
txt =
"【8項目チェック】 " +
"1 EMA全上向き: " + (cond1 ? "達成" : "未達") + " " +
"2 黄金隊列: " + (cond2 ? "達成" : "未達") + " " +
"3 26EMA上2日: " + (cond3 ? "達成" : "未達") + " " +
"4 MACDゼロ上GC: " + (cond4 ? "達成" : "未達") + " " +
"5 出来高1.3-2.0: "+ (cond5 ? "達成" : "未達") + " " +
"6 ローソク条件: " + (cond6 ? "達成" : "未達") + " " +
"7 押し目5-15%: " + (cond7 ? "達成" : "未達") + " " +
"8 ブレイク後押し目: " + (cond8 ? "達成" : "未達") + " " +
"最終三点(ヒゲ×出来高×MACD): " + (final3 ? "成立" : "未成立") + " " +
"判定: " + decision
dbg := label.new(bar_index, high, txt, style=label.style_label_left, textcolor=color.white, color=color.new(color.black, 0))
// アラート
alertcondition(isBuy, title="猛の掟 BUY", message="猛の掟: 買いシグナル(8条件+最終三点)")

takeshi GPT//@version=5
indicator("猛の掟・初動スクリーナーGPT", overlay = true, timeframe = "", timeframe_gaps = true)
// ======================================================
// ■ 1. パラメータ設定
// ======================================================
// EMA長
emaFastLen = input.int(5, "短期EMA (5)", minval = 1)
emaMidLen = input.int(13, "中期EMA (13)", minval = 1)
emaSlowLen = input.int(26, "長期EMA (26)", minval = 1)
// 出来高
volMaLen = input.int(5, "出来高平均期間", minval = 1)
volMultInitial = input.float(1.3, "出来高 初動ライン (×)", minval = 1.0, step = 0.1)
volMultStrong = input.float(1.5, "出来高 本物ライン (×)", minval = 1.0, step = 0.1)
// 押し目・レジスタンス
pullbackLookback = input.int(20, "直近高値の探索期間", minval = 5)
pullbackMinPct = input.float(5.0, "押し目下限 (%)", minval = 0.0, step = 0.1)
pullbackMaxPct = input.float(15.0, "押し目上限 (%)", minval = 0.0, step = 0.1)
// ピンバー判定パラメータ
pinbarWickRatio = input.float(2.0, "ピンバー下ヒゲ/実体 比率", minval = 1.0, step = 0.5)
pinbarMaxUpperPct = input.float(25.0, "ピンバー上ヒゲ比率上限 (%)", minval = 0.0, step = 1.0)
// 大陽線判定
bigBodyPct = input.float(2.0, "大陽線の最低値幅 (%)", minval = 0.1, step = 0.1)
// ======================================================
// ■ 2. 基本テクニカル計算
// ======================================================
emaFast = ta.ema(close, emaFastLen)
emaMid = ta.ema(close, emaMidLen)
emaSlow = ta.ema(close, emaSlowLen)
// MACD
= ta.macd(close, 12, 26, 9)
// 出来高
volMa = ta.sma(volume, volMaLen)
// 直近高値(押し目判定用)
recentHigh = ta.highest(high, pullbackLookback)
drawdownPct = (recentHigh > 0) ? (recentHigh - close) / recentHigh * 100.0 : na
// ======================================================
// ■ 3. A:トレンド(初動)条件
// ======================================================
// 1. 5EMA↑ 13EMA↑ 26EMA↑
emaUpFast = emaFast > emaFast
emaUpMid = emaMid > emaMid
emaUpSlow = emaSlow > emaSlow
condTrendUp = emaUpFast and emaUpMid and emaUpSlow
// 2. 黄金並び 5EMA > 13EMA > 26EMA
condGolden = emaFast > emaMid and emaMid > emaSlow
// 3. ローソク足が 26EMA 上に2日定着
condAboveSlow2 = close > emaSlow and close > emaSlow
// ======================================================
// ■ 4. B:モメンタム(MACD)条件
// ======================================================
// ヒストグラム縮小+上向き
histShrinkingUp = (math.abs(histLine) < math.abs(histLine )) and (histLine > histLine )
// ゼロライン直下〜直上での上向き
nearZeroRange = 0.5 // ゼロライン±0.5
macdNearZero = math.abs(macdLine) <= nearZeroRange
// MACDが上向き
macdTurningUp = macdLine > macdLine
// MACDゼロライン上でゴールデンクロス
macdZeroCrossUp = macdLine > signalLine and macdLine <= signalLine and macdLine > 0
// B条件:すべて
condMACD = histShrinkingUp and macdNearZero and macdTurningUp and macdZeroCrossUp
// ======================================================
// ■ 5. C:需給(出来高)条件
// ======================================================
condVolInitial = volume > volMa * volMultInitial // 1.3倍〜 初動点灯
condVolStrong = volume > volMa * volMultStrong // 1.5倍〜 本物初動
condVolume = condVolInitial // 「8掟」では1.3倍以上で合格
// ======================================================
// ■ 6. D:ローソク足パターン
// ======================================================
body = math.abs(close - open)
upperWick = high - math.max(close, open)
lowerWick = math.min(close, open) - low
rangeAll = high - low
// 安全対策:0除算回避
rangeAllSafe = rangeAll == 0.0 ? 0.0000001 : rangeAll
bodyPct = body / close * 100.0
// ● 長い下ヒゲ(ピンバー)
lowerToBodyRatio = (body > 0) ? lowerWick / body : 0.0
upperPct = upperWick / rangeAllSafe * 100.0
isBullPinbar = lowerToBodyRatio >= pinbarWickRatio and upperPct <= pinbarMaxUpperPct and close > open
// ● 陽線包み足(bullish engulfing)
prevBearish = close < open
isEngulfingBull = close > open and prevBearish and close >= open and open <= close
// ● 5EMA・13EMAを貫く大陽線
crossFast = open < emaFast and close > emaFast
crossMid = open < emaMid and close > emaMid
isBigBody = bodyPct >= bigBodyPct
isBigBull = close > open and (crossFast or crossMid) and isBigBody
// D条件:どれか1つでOK
condCandle = isBullPinbar or isEngulfingBull or isBigBull
// ======================================================
// ■ 7. E:価格帯(押し目位置 & レジスタンスブレイク)
// ======================================================
// 7. 押し目 -5〜15%
condPullback = drawdownPct >= pullbackMinPct and drawdownPct <= pullbackMaxPct
// 8. レジスタンス突破 → 押し目 → 再上昇
// 直近 pullbackLookback 本の高値をレジスタンスとみなす(現在足除く)
resistance = ta.highest(close , pullbackLookback)
// レジスタンスブレイクが起きたバーからの経過本数
brokeAbove = ta.barssince(close > resistance)
// ブレイク後に一度レジ上まで戻したか
pulledBack = brokeAbove != na ? ta.lowest(low, brokeAbove + 1) < resistance : false
// 現在は再上昇方向か
reRising = close > close
condBreakPull = (brokeAbove != na) and (brokeAbove <= pullbackLookback) and pulledBack and reRising
// ======================================================
// ■ 8. 最終 8条件 & 三点シグナル
// ======================================================
// 8つの掟
condA = condTrendUp and condGolden and condAboveSlow2
condB = condMACD
condC = condVolume
condD = condCandle
condE = condPullback and condBreakPull
all_conditions = condA and condB and condC and condD and condE
// 🟩 最終三点シグナル
// 1. 長い下ヒゲ 2. MACDゼロライン上GC 3. 出来高1.5倍以上
threePoint = isBullPinbar and macdZeroCrossUp and condVolStrong
// 「買い確定」= 8条件すべて + 三点シグナル
buy_confirmed = all_conditions and threePoint
// ======================================================
// ■ 9. チャート表示 & スクリーナー用出力
// ======================================================
// EMA表示
plot(emaFast, color = color.orange, title = "EMA 5")
plot(emaMid, color = color.new(color.blue, 10), title = "EMA 13")
plot(emaSlow, color = color.new(color.green, 20), title = "EMA 26")
// 初動シグナル
plotshape(
all_conditions and not buy_confirmed,
title = "初動シグナル(掟8条件クリア)",
style = shape.labelup,
color = color.new(color.yellow, 0),
text = "初動",
location = location.belowbar,
size = size.small)
// 三点フルシグナル(買い確定)
plotshape(
buy_confirmed,
title = "三点フルシグナル(買い確定)",
style = shape.labelup,
color = color.new(color.lime, 0),
text = "買い",
location = location.belowbar,
size = size.large)
// スクリーナー用 series 出力(非表示)
plot(all_conditions ? 1 : 0, title = "all_conditions (8掟クリア)", display = display.none)
plot(buy_confirmed ? 1 : 0, title = "buy_confirmed (三点+8掟)", display = display.none)

True Gap Finder with Revisit DetectionTrue Gap Finder with Revisit Detection
This indicator is a powerful tool for intraday traders to identify and track price gaps. Unlike simple gap indicators, this script actively tracks the status of the gap, visualizing the void until it is filled (revisited) by price.
Key Features:
Active Gap Tracking: Finds gap-up and gap-down occurrences (where Low > Previous High or High < Previous Low) and actively tracks them.
Gap Zones (Clouds): Visually shades the empty "gap zone" (the void between the gap candles), making it instantly obvious where price needs to travel to fill the gap. The cloud disappears automatically once the gap is filled.
Dynamic Labels: automatically displays price labels at the origin of the gap, showing the specific price range (High-Low) that constitutes the gap. Labels are positioned intelligently to avoid cluttering current price action.
Alerts: Configurable alerts notify you the moment a gap is filled.
Customization: Full control over colors, clouds, labels, and alert settings to match your chart style.
How it works: The indicator tracks the most recent gap. If a new gap forms, it becomes the active focus. When price moves back to "close" or "fill" this gap area, the lines and clouds automatically stop plotting, giving you a clean chart that focuses only on open business.

Entry Scanner Conservative Option AKeeping it simple,
Trend,
RSI,
Stoch RSI,
MACD, checked.
Do not have entry where there is noise on selection, look for cluster of same entry signals.
If you can show enough discipline, you will be profitable.
CT

Dynamische Open/Close Levels mit Historie🎯 Key Features
This indicator provides clean, configurable horizontal lines showing the Open and Close prices of a higher chosen timeframe (e.g., the last 5-minute candle), serving as dynamic support and resistance levels.
Unlike traditional indicators that draw messy "steps" across your entire chart, this tool is designed for clarity and precise control.
Controlled History: Easily define how many of the last completed periods (e.g., 5-minute blocks) should remain visible on the chart. Set to 0 for only the current, active levels.
No Stepladder Effect: Uses advanced drawing methods (line.new and object management) to ensure the historical levels remain static and do not clutter your chart history.
Dynamic Labels: The labels (e.g., "Open (5)") automatically adjust to show the timeframe you configured in the indicator settings, eliminating confusion when switching timeframes.
Customizable: Full control over colors, line length, and label positioning/size.
💡 Ideal Use Case
Perfect for scalpers and day traders operating on lower timeframes (1m, 3m) who want to quickly visualize and respect crucial price action levels from a higher context (e.g., 5m, 15m, 1h).

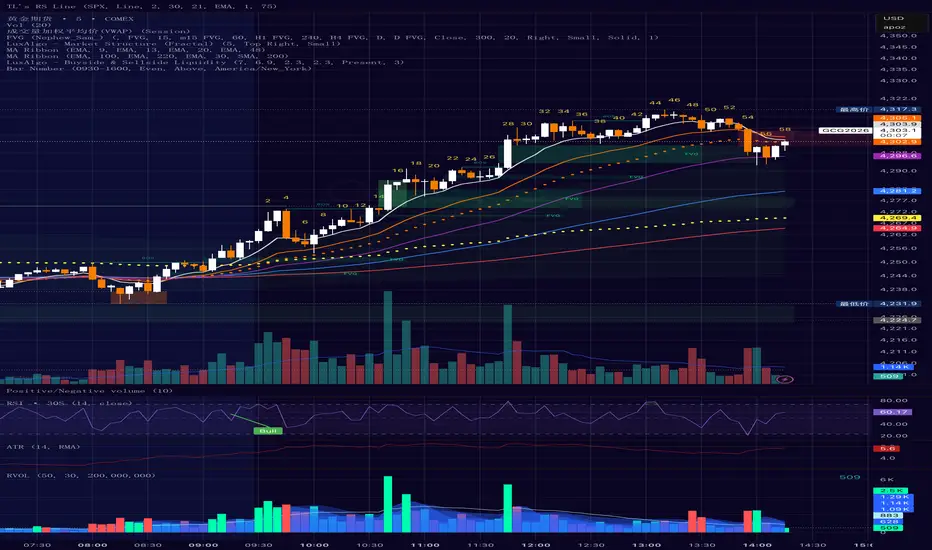
Bar Number IndicatorBar Number Indicator
This Pine Script indicator is designed to help intraday traders by automatically numbering candlesticks within a user-defined trading session. This is particularly useful for strategies that rely on specific bar counts (e.g., tracking the 1st, 18th, or 81st bar of the day).
Key Features:
Session-Based Counting: Automatically resets the count at the start of each new session (default 09:30 - 16:00).
Timezone Flexibility: Includes a dropdown to select your specific trading timezone (e.g., America/New_York), ensuring accurate session start times regardless of your local time or the exchange's default setting.
Smart Display Modes: Choose to show "All" numbers, or filter for "Odd" / "Even" numbers to keep your chart clean.
Custom Positioning: Easily place the numbers Above or Below the candlesticks.
Minimalist Design: Numbers are displayed as floating text without distracting background bubbles.
Simple ICT Sweep + FVG (LuxAlgo Swings FIXED)something i created if anyone can improve it or change for better visual

Volatility High/Low Projection (PHOD / PLOD)AP Capital – Volatility + High/Low Projection
This indicator is designed to identify high-probability intraday turning points by combining daily range statistics, session behaviour, and volatility context into a single clean framework.
It is built for index, forex, and metals traders who want structure, not noise.
🔹 Core Features
1️⃣ Potential High of Day (PHOD) & Potential Low of Day (PLOD)
The indicator highlights likely intraday extremes based on:
Session timing (Asia, London, New York)
Current day volatility vs historical averages
Prior day expansion or compression behaviour
Each level is displayed with:
A clear label (PHOD / PLOD)
A forward-extending box acting as a live Point of Interest (POI)
Automatic invalidation when price breaks the zone
2️⃣ Volatility & Range Context (Info Panel)
A compact information panel in the top-right corner provides real-time context without cluttering the chart:
20-Day Average Range
% of the average range already used today
Range status (NORMAL / EXHAUSTED)
Average session ranges for:
Asia
London
New York
This allows traders to immediately assess whether price is:
Early in the day with room to trend
Statistically stretched and prone to reversal
Over-extended where breakout chasing is risky
3️⃣ Session-Aware Logic
The model respects how markets behave across the trading day:
Asia favours accumulation and potential lows
London provides expansion
New York often delivers distribution or exhaustion
This prevents random high/low marking and focuses only on structurally meaningful levels.
🧠 How to Use
Use PHOD / PLOD boxes as reaction zones, not blind entries
Combine with your own confirmation (structure break, momentum, volume, EMA reclaim, etc.)
Avoid chasing trades when the Range Status = EXHAUSTED
Particularly effective on 15m – 1h timeframes
⚠️ Important Notes
This indicator does not repaint
It is contextual, not a buy/sell signal generator
Best used as part of a complete trading plan
📈 Suitable Markets
XAUUSD (Gold)
Indices (NASDAQ, S&P 500, DAX)
Major FX pairs
📌 Disclaimer
This indicator is for educational and analytical purposes only.
It does not constitute financial advice. Trading involves risk.

ORB + Killzones - Universal AutoORB + Killzones • Universal Auto
A clean overlay indicator that automatically plots 15-minute Opening Range Breakout (ORB) levels for major global sessions with full DST handling and optional Killzone shading.
Key Features
Universal auto-detection: adapts session times and timezones perfectly for crypto (24/7) and traditional markets (cash hours only)
15-minute ORB high/low lines for Tokyo, Hong Kong, China, London, and New York sessions
Precise DST-aware London (Europe/London) and New York (America/New_York) sessions
Optional translucent Killzone background shading: London Open (0800–1100), NY Open (0930–1100), London Close (1530–1630) — with custom colors and transparency
Individual toggle switches for each session ORB and Killzone display
Clean neon color scheme matching popular retrowave setups (Tokyo teal, HK magenta, China red, London blue, NY gold)
Efficient drawing with persistent lines that extend until session end
No repainting, low resource usage (max 250 lines, 60 labels)
Ideal for ICT/SMC traders who want accurate multi-session ORBs and high-probability Killzone windows on any instrument or timeframe. Works on forex, indices, stocks, and crypto.
Recommend to uncheck timeframes over 1 hour in the Visibility tab of the Settings.

Session Levels + PDH/PDL (Adjustable, v6 fixed) 📊 Session Levels + PDH/PDL (Adjustable)
This indicator plots key intraday reference levels based on major market sessions and the previous day’s range. It is designed for traders who rely on session highs/lows, liquidity levels, and market structure rather than indicators like EMAs or oscillators.
🔹 What it shows
Asia Session High & Low
UK (London) Session High & Low
New York Session High & Low
Previous Day High (PDH) & Previous Day Low (PDL)
Each level is drawn as a horizontal line and can optionally include a label for quick identification.
⚙️ Fully adjustable
Session times for Asia, UK, and New York are fully editable
Custom colors for each session and PDH/PDL
Show / hide toggles for each session individually
Adjustable line width and right-side extension
Optional session background shading with adjustable transparency
Optional labels for all levels
🕒 Timezone handling
Uses a user-defined timezone (default: Europe/Dublin)
Works on any intraday timeframe
Session logic is replay-safe and does not repaint past levels
🎯 How traders typically use it
Identify liquidity pools at session highs/lows
Use PDH/PDL as targets, reactions, or bias levels
Combine with price action, market structure, ORBs, or ICT-style models
Mark London and NY expansions after Asia range is set
✅ Designed for
Futures traders (ES, NQ, YM, Gold)
Forex and indices
Intraday & session-based strategies
Traders who want clean charts with meaningful levels only

FOMC Sweep Reaction AP Capital – FOMC Sweep Reaction v1.0
AP Capital – FOMC Sweep Reaction v1.0 is a news-reaction and liquidity-based trading tool designed specifically to track and trade FOMC volatility on Gold (XAUUSD) and other highly reactive instruments.
The indicator focuses on liquidity sweeps, structure breaks, and EMA reclaims that commonly occur around Federal Reserve interest-rate decisions and Powell speeches, helping traders identify high-probability reversal or continuation moves after the initial spike.
🔍 What This Indicator Detects
This tool highlights the most repeatable FOMC behaviours observed across multiple months of broker data:
• Sweeps of previous day’s high or low
• Stop-hunt wicks into liquidity pools
• EMA13 reclaim after the news spike
• Break and close beyond short-term structure
• Momentum shift following volatility exhaustion
The goal is not to predict the news, but to react to confirmed price behaviour after liquidity has been taken.
📌 Core Features
• FOMC Sweep Detection
Identifies aggressive wicks into prior highs/lows during news volatility
• EMA Reclaim Confirmation
Uses EMA13 to validate momentum shift after the sweep
• Market Structure Awareness
Filters reactions that fail to break structure to avoid false reversals
• Session-Aligned Logic
Designed around London → NY → FOMC release timing
• Clean Visuals
Minimal chart clutter for fast decision-making during volatile conditions
🧠 How to Use
Wait for FOMC release / Powell speech
Allow price to sweep previous liquidity (PDH / PDL / local extremes)
Observe reclaim of EMA13
Enter only after structure confirmation
Manage trade using EMA trailing or structure-based exits
⚠️ This is a reaction system, not a prediction tool.
📊 Best Use Cases
• XAUUSD (Gold)
• NASDAQ / US indices
• High-impact macro news events
• 5-min to 15-min timeframes
⚠️ Important Notes
• News volatility is extreme — risk management is essential
• Not designed for low-volatility or ranging markets
• Best combined with a clear trading plan and strict risk rules
📎 Disclaimer
This indicator is for educational purposes only and does not constitute financial advice. Trading during high-impact news events involves significant risk.

Session Killzone & Liquidity Sweep Engine [2025]A session-based market analysis tool designed to visualize key intraday trading sessions and monitor price interaction with session highs and lows.
The script draws configurable session ranges (Asia, London, New York AM, Lunch, and PM) using session-based boxes. For each session, the high and low levels are calculated in real time and projected forward as reference levels.
Each session high and low reacts dynamically to price behavior:
• If price wicks beyond a session level without a candle close beyond it, the level is marked as a liquidity sweep and stops extending.
• If price closes beyond a session level, the level is considered invalidated and removed.
Optional midpoint levels can be displayed for each session. Users can choose whether levels extend only until mitigation or continue beyond it, as well as whether only the most recent session or all past sessions are tracked.
Additional features include:
• Timezone support with proper session alignment
• Session drawing limits to manage chart clutter
• Timeframe filtering to restrict drawings to lower timeframes
• Optional alerts when session highs or lows are broken by a candle close
• Extensive customization for colors, line styles, labels, and visibility
This tool is intended for traders who analyze intraday price behavior around session highs and lows and want a structured way to observe wick-based interactions and level invalidations.


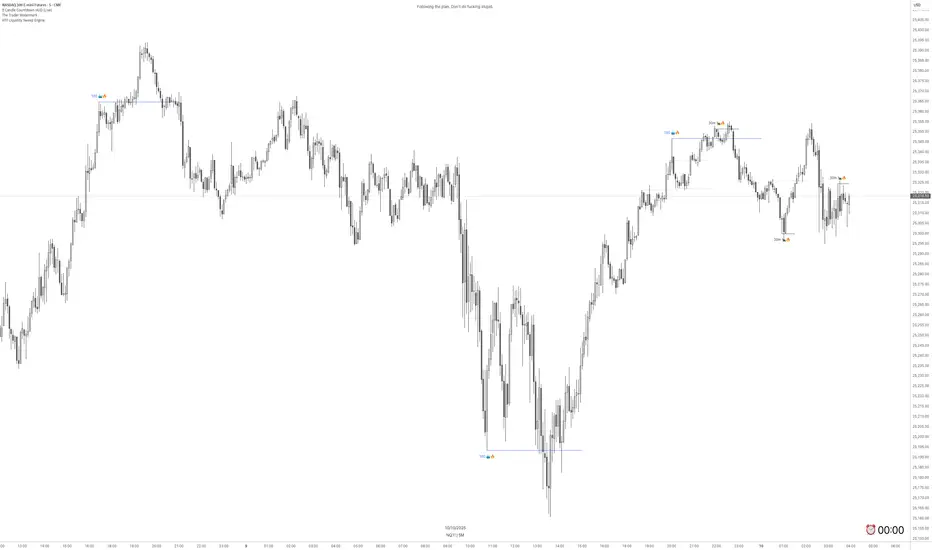
HTF Liquidity Sweep EngineHTF Liquidity Sweep Detector (Dual HTF)
Overview
This indicator is designed to identify validated liquidity sweeps on Higher Timeframes (HTF) and project them accurately onto lower-timeframe charts.
Unlike basic sweep indicators that mark every high or low break, this tool applies context-aware validation and invalidation logic to distinguish meaningful liquidity events from random volatility.
The script supports two independent higher timeframes (HTF 1 & HTF 2), allowing traders to analyze liquidity hierarchy and confluence across multiple market structures within a single chart.
⸻
Core Concept
A liquidity sweep is not considered valid simply because price exceeds a previous high or low.
This script evaluates each sweep within the structural context of the HTF candle that formed it, accounting for:
• Bullish vs bearish candle structure
• Open, close, high, and low relationships
• Temporal sequencing between HTF candles
Sweeps are treated as stateful events with a full lifecycle rather than static lines.
⸻
Sweep Lifecycle & Invalidation Logic
Each detected sweep progresses through multiple states:
• Formation – A sweep is detected when price exceeds a prior HTF high or low under valid structural conditions.
• Validation – The sweep remains provisional until subsequent HTF candles confirm it.
• Invalidation – If later HTF price action violates the structural conditions, the sweep is automatically marked as invalidated.
• Removal – Sweeps that fail during their formation phase are removed entirely to avoid misleading signals.
This approach ensures that only structurally meaningful sweeps remain visible on the chart.
⸻
Dual Higher-Timeframe Analysis
HTF 1 and HTF 2 operate as separate liquidity layers, each with independent:
• Detection logic
• Validation and invalidation rules
• Visualization styles
This allows traders to identify:
• HTF liquidity alignment
• Higher-timeframe dominance
• Confluence or conflict between liquidity zones
⸻
Projection to Lower Timeframes
Detected HTF sweeps are dynamically projected onto the active chart timeframe.
Sweep levels update in real time and maintain accurate positioning relative to HTF candle boundaries, ensuring visual consistency across timeframes.
⸻
Valid Pullback Swing Line (Optional)
An optional internal swing structure module is included to identify valid pullback swings.
This feature tracks structural pivots, updates dynamically, and automatically invalidates broken swing structures, helping traders contextualize liquidity sweeps within current market structure.
⸻
Customization
Each HTF layer supports full independent customization:
• Enable / disable HTF layers
• Timeframe selection and lookback depth
• Sweep and invalidation line styles, colors, and widths
• Label and marker display options
• Label positioning and sizing
• Alert notifications for sweep formation
⸻
Alerts
Optional alerts trigger when a liquidity sweep is formed, allowing traders to monitor potential liquidity events without constant chart supervision.
⸻
This script is published as closed-source because its sweep validation, invalidation, and multi-timeframe interaction logic represents the core intellectual property of the tool.
The description above is intended to provide conceptual clarity without disclosing proprietary implementation details.
⸻
Intended Use
This indicator is designed as a market structure and liquidity analysis tool, not a standalone trading system.
It is best used in combination with price action, higher-timeframe bias, and risk management principles.
Navigator Volume Profil FixedLong Term Investing
Day Trading
Navigator Volume Profile Fixed (Fixed + Current Session)
**Navigator Volume Profile Fixed** plots a horizontal volume profile on your chart using a **fixed timeframe anchor** (ex: Daily) and optionally overlays a **live “current” profile** for the active session/period.
It’s designed to help you quickly see where volume is building (acceptance) vs. thinning out (rejection), and to identify the key reference levels traders watch most: **PoC, VAH, and VAL**.
### What it plots
**Fixed Volume Profile (anchored to a timeframe)**
Builds a completed profile each time the selected anchor timeframe rolls over (ex: each new day on a Daily anchor).
**Current Volume Profile (live)**
Continuously updates the developing profile for the current anchor period (optional toggle).
**Point of Control (PoC)**
Highlights the single price level with the highest traded volume.
**Value Area (VAH / VAL)**
Plots the Value Area boundaries using a configurable percentage (default **68%**), and visually differentiates the value area from the rest of the profile.
Key settings
* **Enable Fixed VP**: turn the fixed/anchored profile on/off
* **Timeframe Anchor**: choose the profile reset period (ex: 1D)
* **Show Current Fixed VP**: show/hide the developing (current) profile
* **Number of Rows**: controls profile resolution (price “bins”)
* **Profile Width (%)** and **Bar Thickness**: visual scaling controls
* **PoC + Value Area toggles**: show/hide PoC and VA boundaries
* **Extend PoC Line**: optionally extend the PoC into the future
How to use it (practical)
* Treat **PoC** as the most accepted price for the anchored period.
* Use **VAH/VAL** as reference boundaries for balance vs. imbalance.
* Compare **Fixed** vs **Current** profiles to see whether volume is migrating higher/lower during the session and where price is building acceptance.
**Note:** This script draws using TradingView line objects and is optimized to stay within platform limits while maintaining a clean profile display.

