チャートパターン
THE ORACLE v5 Quantum Flow Engine📚 Learn my full system for free
Education, live sessions and strategy breakdowns: howtobebullish.com
💰 Want me to trade for you
Invest with my team through the managed accounts: 4xprophet.com/mam
📲 Socials
Instagram and YouTube: @mrkilldamarkets
⸻
🧠 What is THE ORACLE v5
THE ORACLE v5 is my institutional style market assistant.
It does not try to predict the future with magic. It reads the current regime and answers one simple question:
“Is this a quality location to be involved in this market or should I sit on my hands”
The engine watches
• Structure and smart money concepts
• Volume and order flow pressure
• VWAP and premium or discount zones
• Multi timeframe trend alignment
• Momentum and volatility conditions
• Session and killzone timing
Every bar it builds an internal score and only throws a signal when enough conditions line up.
You are not buying the logic from this description. You are just getting a clean interface to read what the engine is already calculating behind the scenes.
⸻
🚀 Quick start
1️⃣ Add THE ORACLE v5 to your chart
Use it mainly on Gold and major CFD pairs. It works intraday and swing, but stay consistent with the timeframe you choose.
2️⃣ Choose your mode in the settings
• Sniper for very selective trades
• Aggressive for more frequent setups
• Scalper for faster moves
• Swing for higher timeframe bias and cleaner locations
3️⃣ Watch the signal labels on the chart
• Green LONG labels show long opportunities
• Red SHORT labels show short opportunities
Each one comes with a confidence grade so you can quickly decide if it deserves your attention or just a screenshot for study.
⸻
📺 Reading the terminal dashboard
Top panel is your mission control. It shows things like
• Current algo status scanning, long, or short
• Market structure bullish, bearish, or ranging
• Higher timeframe bias and how many timeframes agree
• Volume state normal, active, institutional, extreme
• Valuation relative to VWAP premium, discount, extreme
• Volatility and regime expansion or contraction
• Session context London, New York, killzones, or off hours
Use it like a checklist. If the terminal is screaming premium, extreme volatility and off session, you know you are forcing trades. If you see discount, aligned bias, clean session and a fresh signal, that is where you lean in.
⸻
🎯 How to use the signals
When a new LONG or SHORT signal appears:
1️⃣ Check the dashboard first
Is structure aligned with the direction
Is the multi timeframe bias agreeing
Is volume supportive or dead
2️⃣ Look at the TP and SL ladder the script prints
You will see
• Suggested stop location
• Three take profit levels
Use these as a framework. You still choose your exact execution and partials.
3️⃣ Size your risk
The risk section lets you think in risk per trade rather than random lot size. Keep risk controlled, especially if you are new to the engine.
4️⃣ Respect the mode you chose
On Sniper mode you should expect less trades but better conditions. Do not compare it to an aggressive scalper mode and call it slow.
⸻
📝 Pending order system
The pending orders section is there for traders who want to set levels in advance instead of chasing price.
The engine can suggest
• Buy limits in discount zones or at key pullback levels
• Sell limits in premium zones or at supply style areas
• Buy stops above breakout areas
• Sell stops below breakdown areas
For each pending idea you will see
• Entry
• Stop
• TP one and TP two
• Reason for the idea such as VWAP retest, discount band, breakout stop
You still decide if you actually place that order. Think of it as a smart assistant highlighting levels, not a robot you obey blindly.
⸻
🧩 How this fits in your trading
Use THE ORACLE v5 as
• A regime detector to tell you when the market is worth touching
• A confluence layer on top of your own strategy
• A way to track structure, volume and VWAP without drawing everything by hand
You bring
• Your own playbook
• Your own risk rules
• Your own discipline
The engine brings the data and structure so you can move like a desk, not a random retail trader.
⸻
⚠️ Disclaimer
This is a tool for analysis and trade assistance, not financial advice or a guarantee of profit.
Trading CFDs, forex and futures carries significant risk. Do your own research, test everything in demo and never risk money you cannot afford to lose.

HEIST PROPHECY MASTER SUITE v20This is the top level HEIST engine.
Your all-in-one institutional scanner that blends breakout logic, structure mapping, smart zones, trend state and an execution dashboard into one visual system.
MASTER SUITE v20 is built for traders who want everything on the chart without clutter and without guesswork.
You get the bigger picture
the structure
the direction
the levels
and the execution map
all in a single interface.
No strategy leaks.
No code exposure.
Only the outputs.
⸻
⭐ What it displays
• High quality buy and sell signals
• Visual structure shifts (BOS / CHoCH)
• Supply and demand zones
• Liquidity sweep markers
• Clean trend read
• ATR-based risk framework
• TP1, TP2 and TP3 projections
• A compact institutional dashboard showing direction, entry, stop and targets
Everything is visual.
Internal logic stays private.
⸻
⭐ How to use MASTER SUITE v20
1. Load the indicator
Works best on:
• Gold
• Indices
• Major FX pairs
2. Read the trend and signal panel
The dashboard instantly tells you:
• Bullish or bearish trend state
• BUY, SELL or SCANNING mode
• Entry, SL and TP levels
This keeps your decision making clean.
3. Let the chart show the story
The visuals help you see:
• When structure shifts
• Where zones of interest form
• Where liquidity gets taken
• Where continuation or reversal may happen
You’re not guessing anymore.
4. When a HEIST signal appears
Use this simple checklist:
• Does it align with your personal bias?
• Does the dashboard confirm direction?
• Do the levels fit your risk profile?
• Is the market clean or chaotic?
Execution is your choice.
The suite simply organizes the environment.
5. Manage the trade using the built-in levels
• SL is placed visually
• TP1, TP2, TP3 help you scale out or let runners go
• Structure cues help you see when momentum shifts
You control the outcome.
The engine just keeps the map clean.
⸻
⭐ Who MASTER SUITE v20 is made for
• Intraday and swing traders
• Gold and index traders
• Structure-based traders
• Continuation and breakout traders
• Traders who want clean execution without clutter
⸻
⭐ What MASTER SUITE v20 is NOT
• Not a bot
• Not financial advice
• Not a guarantee of outcomes
• Not a replacement for your plan
It’s a visual system designed to support professional-level decision making.
⸻
⭐ Join my free trading ecosystem
Learn how I actually use these tools inside my own workflow:
howtobebullish.com
Want passive exposure to my capital systems?
4xprophet.com/mam
Instagram: @mrkilldamarkets
YouTube: @mrkilldamarkets
Telegram: t.me/prophecyorderflow

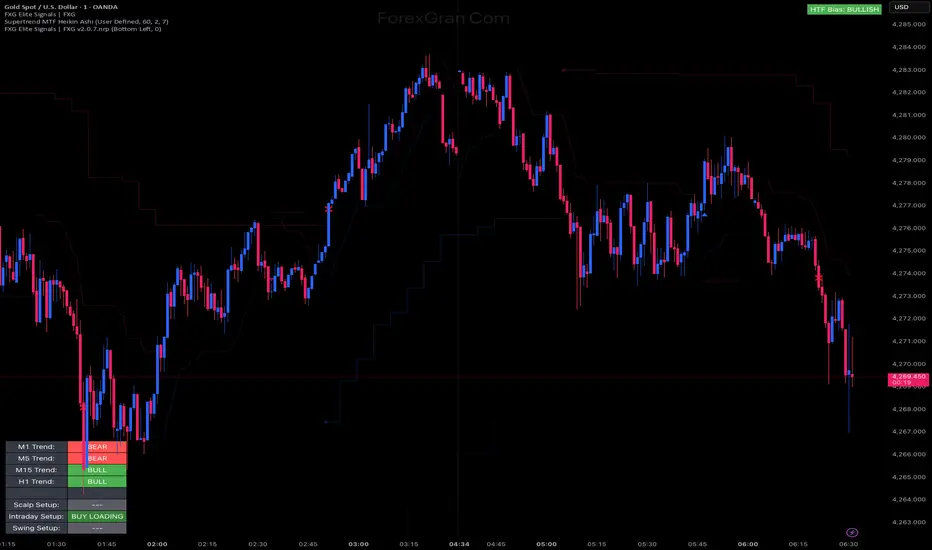
Prophecy Orderflow Institutional v6Free Trading Academy: howtobebullish.com
Invest With My Team: 4xprophet.com/mam
Instagram: @mrkilldamarkets
YouTube: @mrkilldamarkets
Telegram: t.me/prophecyorderflow
⸻
⭐ What Prophecy Orderflow v6 is
A clean intraday execution assistant built to help traders:
• Spot high quality breakouts without noise
• See structured entries instead of guessing
• Get instant clarity with mapped SL and TP levels
• Manage trades more confidently with optional BE and trail visuals
This is an execution support tool, not an automated strategy.
⸻
⭐ What it shows you (WITHOUT revealing the logic)
• Buy or sell signals when momentum breaks cleanly
• A mapped entry zone
• Automatic SL and TP1, TP2, TP3 projections
• Optional break even marker
• Optional trailing guide
• Session on/off filter to avoid dead market hours
• A simple dashboard that keeps everything readable
All logic stays private.
Users only see the output.
⸻
⭐ How to actually use it (clear but not exposing IP)
1. Load the indicator on your preferred chart
Works best on Gold, indices, and major forex pairs.
2. Choose your trading timeframe
Prophecy adapts to 1 minute, 5 minute and 15 minute execution styles.
3. Turn sessions ON if you only want signals during active market hours
London and New York sessions usually feel the cleanest.
4. When a signal prints, follow this simple decision process:
• Does it align with your personal bias?
• Is the market moving clean or is it choppy?
• Does the mapped SL and TP structure make sense for your plan?
If yes, you trade it.
If not, you skip it.
No overthinking.
5. Manage the trade using the visuals
• SL and TP levels update instantly
• BE line shows when you can neutralize risk
• Trail line appears only when the move is strong enough
You choose how much you want to lock in or let run.
⸻
⭐ Who it’s designed for
• Scalpers who need clean entries
• Intraday traders who want structure
• Traders who struggle with SL and TP placement
• Gold and index traders who need fast visual clarity
⸻
⭐ Important Notes
• Not financial advice
• Not a bot
• Use your own risk management
• Backtest and forward test before sizing up
⸻
⭐ Access the full trading ecosystem
Free Academy: howtobebullish.com
Invest Into My Capital Systems: 4xprophet.com/mam
Instagram: @mrkilldamarkets
YouTube: @mrkilldamarkets
Telegram: t.me/prophecyorderflow

King StrategyKing Strategy is an all-in-one TradingView edge for scalpers, swing traders and prop- or hedge-fund pros alike. It blends classic pattern flags with institutional-grade filters to pinpoint high-probability long entries and exits—and displays them with instant visual cues (buy/sell flags, dynamic backgrounds, trend-lines, support/resistance and volume-zones).
Built-in time-of-day and cycle locks help tame overtrading, and every signal lives in a single Inputs panel so you can toggle filters, tweak risk parameters and dial in exits in seconds. Whether you’re chasing 1-minute scalps or planning multi-day swings, S85 keeps you in sync with the market—just fine-tune its tools to match your timeframe, liquidity and comfort with risk.

ORB Strategy: Extensions & Custom SL (EOD & Live Lines)That's a great request. Since you've now built a complex Pine Script Strategy with several user-configurable risk management, targeting, and exit options, the description should focus on the systematic rules used for entering, managing, and exiting trades.
Here is a clear, written description of the trading strategy you have built:
Trading Strategy Description: ORB Extension Breakout with Custom Stop, Live Tracking, and EOD Exit
This strategy is a systematic, momentum-based system designed for intraday trading. It operates on the principle of an Opening Range Breakout (ORB), utilizing the initial market consolidation to project high-probability targets, while offering multiple methods for managing risk and enforcing a mandatory end-of-day closure.
1. Market Identification (The Opening Range)
The strategy first defines the market's initial boundaries and volatility:
Session Window: The strategy calculates the Opening Range (OR) over a user-defined time period (default: 9:30 AM to 10:30 AM New York Time).
ORB Levels: Two key price levels are established and locked once the time window closes:
Wick High/Low: The absolute highest and lowest prices of the session. These serve as the entry trigger lines.
Body High/Low (Shaded Range): The highest and lowest open/close prices of the session. The height of this range is used as the basis for calculating all targets and stops.
2. Entry Rule (The Breakout)
The strategy waits passively for a breakout that confirms direction and ensures the move has not yet reached its immediate target.
Trigger Condition: A trade is signaled when a candle closes either:
Above the Wick High (for a Long entry).
Below the Wick Low (for a Short entry).
Constraint (Fresh Breakout): The entry is invalidated if the breakout candle's price action (High for Long, Low for Short) has already touched or surpassed the projected Take Profit (0.5 Extension) level before the candle closes.
Execution: The entry is a Market Order executed on the candle that meets the trigger conditions, subject to a user-defined Entry Delay (default 0 bars).
Direction Control: The user can select to trade Long Only, Short Only, or Both.
3. Exit and Risk Management
All trades are placed with simultaneous Take Profit and Stop Loss orders (a bracket order) upon entry.
A. Take Profit (TP)
The Take Profit is set at the 0.5 Extension of the Shaded Range (Body Range).
Calculation: The distance from the Body High/Low to the TP level is exactly 50% of the total height of the Shaded Range.
B. Stop Loss (SL)
The Stop Loss is dynamically calculated based on a user-selected method for risk control:
Range 0.5 (Body Range): The SL is placed an equal distance (0.5 times the Body Range height) outside the opposite side of the Body Range.
ATR Multiple: The Stop Loss distance is calculated as a user-defined Multiplier times the Average True Range (ATR).
Recent Swing Low/High: The Stop Loss is placed based on a structural low (for Long) or high (for Short) within a user-defined lookback period.
C. End-of-Day (EOD) Exit
Any open position is forced closed at the market price if it is still open when the user-defined closing time (default: 16:00 HHMM) is reached. This prevents carrying intraday risk overnight.
4. Visualization
The strategy includes comprehensive visual cues for analysis:
ORB Drawing: Displays the Wick High/Low and the shaded Body Range.
Breakout Signals: Highlights the specific bar where the validated entry signal occurs.
Closed Trades: Draws persistent lines for the Entry and Exit prices of the last few closed trades.
Live Open Trades: Draws persistent lines for the current Entry Price, active Take Profit Level, and active Stop Loss Level for any open position.

True Gap Finder with Revisit DetectionTrue Gap Finder with Revisit Detection
This indicator is a powerful tool for intraday traders to identify and track price gaps. Unlike simple gap indicators, this script actively tracks the status of the gap, visualizing the void until it is filled (revisited) by price.
Key Features:
Active Gap Tracking: Finds gap-up and gap-down occurrences (where Low > Previous High or High < Previous Low) and actively tracks them.
Gap Zones (Clouds): Visually shades the empty "gap zone" (the void between the gap candles), making it instantly obvious where price needs to travel to fill the gap. The cloud disappears automatically once the gap is filled.
Dynamic Labels: automatically displays price labels at the origin of the gap, showing the specific price range (High-Low) that constitutes the gap. Labels are positioned intelligently to avoid cluttering current price action.
Alerts: Configurable alerts notify you the moment a gap is filled.
Customization: Full control over colors, clouds, labels, and alert settings to match your chart style.
How it works: The indicator tracks the most recent gap. If a new gap forms, it becomes the active focus. When price moves back to "close" or "fill" this gap area, the lines and clouds automatically stop plotting, giving you a clean chart that focuses only on open business.

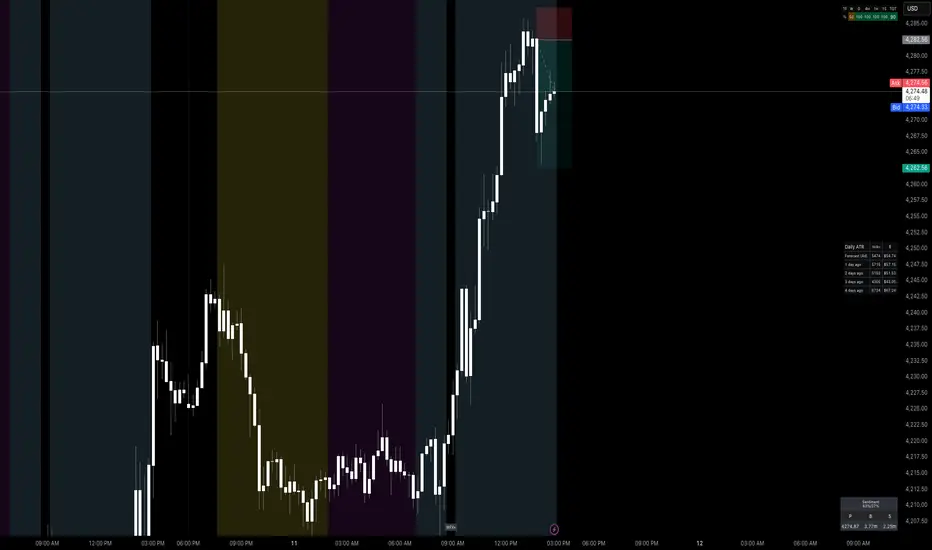
Worstfx Fractal Sessions 🧩 Worstfx Fractal Sessions Public — Features & Purpose
✔️ Includes clean session structure • Simple confluence • Built-in guardrails for your psychology
Worstfx Fractal Sessions Public is a stripped-back, clean version of the full Worstfx framework.
It’s designed to give every trader the core advantages of the fractal system:
• clear session structure
• simple trend/confluence read
• context from Daily ATR
• basic order-flow sentiment
• an on-chart help panel so nobody gets lost
All without overwhelming settings or “indicator soup.”
Use it to see the day as a story: Asia range → London expansion → Pre-NY setup → NY confirmation or reversal.
⸻
⚙️ Main Features
1️⃣ Session Shading (Asia / London / Pre NY / NY)
What it does
• Colors each session with soft, transparent shading:
• Asia – yellow tone
• London – purple tone
• Pre NY – light blue
• NY – light blue (separate time block)
• You can customize the session times and colors.
• Includes a 6:00 pm ET divider line to mark the start of a new “trading day” in your framework.
Why it matters (psychology)
• Your brain stops seeing random candles and starts seeing chapters:
• Asia = range / setup
• London = expansion / fakeouts
• NY = continuation / reversal
• This reduces FOMO and impulsive entries because you naturally ask:
“Which session am I in?”
“What is this session supposed to be doing?”
• The 6pm divider helps you mentally reset each day instead of carrying emotional baggage from yesterday into today.
⸻
2️⃣ Time-Frame Confluence Panel (Weekly → 15m)
What it does
• Checks a simple model on multiple timeframes (W, D, 4H, 1H, 15m):
• Above or below the 50 EMA
• RSI above or below 50
• Converts that into a 0–100% confluence score per TF.
• Gives a %TOTAL score that blends all TFs into a single number.
• Two display modes:
• Strip — horizontal bar with W/D/4H/1H/15m + %TOTAL
• Table — vertical list showing bull% / bear% per TF
• Mobile mode shrinks everything for smaller screens.
Why it matters (psychology)
• Instead of arguing with yourself about “trend,” you get a simple question:
“Are the higher timeframes mostly aligned or mixed?”
• Green/high %TOTAL = “permission” to press your bias, not to over-trade.
• Red/low %TOTAL = natural brake: “This is not the clean trend day. Size down or stay out.”
• It pulls you away from 1-minute tunnel vision and forces you to respect bigger structure.
⸻
3️⃣ Daily ATR Panel (Last 4–12 days + Forecast)
What it does
• Tracks true daily range (High–Low) over recent days.
• Shows:
• Last few days’ range in ticks and $
• Optional 4-day average forecast (projected typical daily move)
• Option to show just last 4 days, or full 12-day history.
• Two modes:
• Table – labeled rows with “ticks / $” columns
• Macro – compact text summary like “FC: 2000t | $20.00”
Why it matters (psychology)
• You stop expecting 5000-tick moves on a 600-tick average day.
• When the forecast is small, you naturally:
• avoid chasing huge targets
• respect partials
• recognize “maybe today just isn’t the big runner”
• On big ATR days, you recognize that volatility is here, so:
• you give your targets breathing room
• you’re less likely to panic when price swings
• This keeps your expectations in line with reality, which reduces tilt, frustration, and revenge trades.
⸻
4️⃣ Order-Flow Sentiment Panel (Compact OF Read)
What it does
• Estimates buy vs sell volume on the current and previous candles.
• Shows:
• Sentiment row with Buy% / Sell%
• Buy/Sell volumes (with “k/m” formatting if enabled)
• Optional extra rows for prior candles.
• Highlights imbalances when one side hits your imbalance threshold (e.g., 70%).
Why it matters (psychology)
• Gives you a quick “who’s in control right now” view without staring at raw volume.
• Imbalance flashes create micro-alerts:
• “This might be a stop run or strong continuation, pay attention.”
• Prevents you from blindly shorting into heavy buy pressure or buying into stacked sell pressure just because of greed or fear.
• Makes your entries feel more validated, which calms you during the trade.
⸻
🧠 Overall Psychological Goal
Worstfx Fractal Sessions Public is not just a visual skin for your charts.
It’s a behavior framework.
It tries to quietly enforce:
• Patience → by tying you to sessions and key time behavior.
• Selectivity → by checking multi-TF trend alignment.
• Realistic expectations → via ATR context.
• Non-impulsive entries → via order-flow imbalance checks.
• Accountability → via clear explanations and structure, not vibes.
Instead of chasing every move, you’re guided into a loop:
“What session am I in? What is ATR saying? Are TFs aligned? Is order-flow confirming? If not, I wait.”
🔋 The risk is minimized by structure & The reward is maximized by timing🔋
Trend Fibo 1.618This indicator is based on the Muslim strategy. I recommend studying it first and also working on a demo account.

ICT Breaker Blocks [Exponential-X]🔄 Breaker Blocks
Overview
Breaker Blocks automatically identifies failed order blocks that have reversed their polarity. When an order block gets broken, it often becomes a powerful support or resistance zone in the opposite direction. This indicator tracks these institutional "flips" based on ICT (Inner Circle Trader) concepts, helping identify where price is likely to find strong support or resistance after a structural break.
━━━━━━━━━━━━━━━━━━━━━━━━━━━━
🎯 What This Indicator Does
Detects Breaker Blocks:
• 🔵 Bullish Breaker Blocks (BB+) - Failed bearish order blocks that became support
• 🟣 Bearish Breaker Blocks (BB-) - Failed bullish order blocks that became resistance
• Tracks order blocks first, then monitors when they break
• Converts broken order blocks into breaker blocks automatically
• Shows when breakers get tested by price
How Breakers Form:
1. Order block forms (last opposite candle before strong move)
2. Price returns and breaks through the order block
3. Broken order block becomes a breaker block with flipped polarity
4. Old resistance becomes new support (or vice versa)
Visual Display: Smart Features:
• Auto-timeframe adjustment for optimal detection
• ATR-based strength filtering
• Active block highlighting
• Test tracking
• Distance calculator
• Duplicate prevention
━━━━━━━━━━━━━━━━━━━━━━━━━━━━
📚 Understanding Breaker Blocks
What Are Breaker Blocks?
Breaker blocks are failed order blocks that price has broken through. In ICT methodology:
• When institutions place orders creating an order block
• If that level fails and price breaks through
• The zone often becomes strong support/resistance in the opposite direction
• This represents institutional position flipping
Why Breakers Form:
• Failed Defense: Institutions couldn't defend the original level
• Position Flip: Institutions reversed their position
• Stop Hunt Complete: After sweeping stops, new levels form
• Polarity Change: Old resistance becomes new support (or vice versa)
Key Difference From Order Blocks: [/b>
• Order Block: Original institutional level (unbroken)
• Breaker Block: Failed order block that flipped polarity
• Breakers often provide STRONGER reactions than original OBs
• Represents where institutions changed their strategy
━━━━━━━━━━━━━━━━━━━━━━━━━━━━
🔵 Bullish Breaker Blocks Explained
Formation Process:
1. Step 1: Bearish order block forms (last bullish candle before drop)
2. Step 2: Price breaks ABOVE this bearish OB
3. Step 3: The broken bearish OB becomes a bullish breaker
4. Step 4: Now acts as SUPPORT when price returns
What It Means:
• Old resistance level failed
• Institutions flipped from selling to buying
• When price returns, zone acts as strong support
• Higher probability long setup than regular support
Trading Bullish Breakers:
Entry Setup:
• Wait for price to retrace back to bullish breaker
• Look for rejection/bounce from the breaker zone
• Enter long when price respects the breaker as support
• Stop loss: Below the breaker block
• Target: Recent high or opposite breaker
Why It Works:
Failed resistance becoming support is a strong technical signal indicating structural change in market sentiment.
━━━━━━━━━━━━━━━━━━━━━━━━━━━━
🟣 Bearish Breaker Blocks Explained
Formation Process:
1. Step 1: Bullish order block forms (last bearish candle before rally)
2. Step 2: Price breaks BELOW this bullish OB
3. Step 3: The broken bullish OB becomes a bearish breaker
4. Step 4: Now acts as RESISTANCE when price returns
What It Means:
• Old support level failed
• Institutions flipped from buying to selling
• When price returns, zone acts as strong resistance
• Higher probability short setup than regular resistance
Trading Bearish Breakers:
Entry Setup:
• Wait for price to retrace back to bearish breaker
• Look for rejection/reversal from the breaker zone
• Enter short when price respects the breaker as resistance
• Stop loss: Above the breaker block
• Target: Recent low or opposite breaker
Why It Works:
Failed support becoming resistance indicates structural change and often leads to continuation moves.
━━━━━━━━━━━━━━━━━━━━━━━━━━━━
📊 How To Use This Indicator
Strategy 1: Breaker Block Retest
Timeframes: 15min, 1H, 4H
Style: [/b> Swing trading, reversal entries
Rules:
1. Identify active breaker block (bright color, not gray)
2. Wait for price to return to the breaker zone
3. Look for reversal confirmation (pin bar, engulfing, rejection)
4. Enter in the direction the breaker suggests
5. Stop: Beyond opposite side of breaker
6. Target: 2-3R or previous structure
Example - Bullish Breaker:
• Bullish breaker at $48,000-$48,500
• Price drops to $48,200 (enters breaker)
• Bullish pin bar forms
• Enter long at $48,600, stop at $47,800
• Target: $50,000+
Strategy 2: Multi-Timeframe Breakers
Timeframes: Combine 1H + 4H or 15min + 1H
Style: [/b> High-probability setups
Rules:
1. Identify breaker on higher timeframe (4H or Daily)
2. Switch to lower timeframe (1H or 15min)
3. Look for lower TF breaker WITHIN higher TF breaker
4. Trade the lower TF breaker in same direction as HTF
5. Stop: Below lower TF breaker
6. Target: Edge of higher TF breaker or beyond
Why It Works: Alignment across timeframes increases probability
Strategy 3: Breaker + Order Block Confluence
Timeframes: 1H, 4H
Style: High-conviction trades
Rules:
1. Find breaker block that overlaps with fresh order block
2. This creates double institutional zone
3. Wait for price to reach confluence area
4. Enter on first touch with confirmation
5. Stop: Beyond confluence zone
6. Target: 3-5R
Why It Works: Two ICT concepts aligned = maximum probability
Strategy 4: Breaker Breakout
Timeframes: [/b> 5min, 15min, 1H
Style: Trend continuation
Rules:
1. Price approaches breaker block
2. Instead of respecting it, price breaks THROUGH
3. This indicates very strong momentum
4. Enter breakout in direction of break
5. Stop: Back inside the breaker
6. Target: 2-3R
Why It Works: When breakers fail, momentum is extremely strong
━━━━━━━━━━━━━━━━━━━━━━━━━━━━
⚙️ Settings Explained
Core Settings
Auto-Adjust for Timeframe (Default: ON)
• Automatically optimizes detection for current chart
• 1min: 3 bars lookback
• 5min: 4 bars lookback
• 15min: 5 bars lookback
• 1H: 6 bars lookback
• 4H+: 8-12 bars lookback
• Recommended: Keep ON
Manual Detection Length (Default: 5)
• Only used when Auto-Adjust is OFF
• Lookback period for finding order blocks
• Lower = more sensitive
• Higher = more selective
Display Settings
Show Bullish/Bearish Breaker Blocks
• Toggle each type independently
• Customize colors (default: cyan and fuchsia)
• Tip: Use colors that stand out from order blocks
Max Breaker Blocks to Display (Default: 10) [/b>
• Limits visible breakers
• Lower (5-8): Cleaner chart
• Higher (15-30): More context
• Recommended: 10-15
Show Breaker Block Labels [/b>
• Displays BB+ and BB- text
• Shows 🎯 on active (nearest) breaker
• Turn OFF for minimal appearance
Extend Blocks (bars) (Default: 50)
• How far to extend boxes to the right
• Recommended: 40-60 bars
Filters
Block Strength Filter (Default: Medium)
• Low: 0.5x ATR - More breakers, more noise
• Medium: 1x ATR - Balanced
• High: 1.5x ATR - Only strongest breakers
• Note: Breakers are naturally less common than OBs
• For learning: Use Low to see more examples
• For trading: Use Medium or High
Min Block Size % (Default: 0.1)
• Minimum breaker size as % of price
• Filters tiny insignificant blocks
• Adjust based on instrument volatility
Advanced
Show Tested Blocks (Default: OFF) [/b>
• When ON: Shows gray boxes for tested breakers
• When OFF: Breakers disappear after test
• Use ON: For learning and analysis
• Use OFF: For clean active trading
Highlight Active Block (Default: ON)
• Highlights nearest breaker to current price
• Active block shown with brighter color and 🎯
• Recommended: Keep ON
━━━━━━━━━━━━━━━━━━━━━━━━━━━━
📱 Info Panel Guide
Bullish BB Count Bearish BB Count
• Number of active (untested) bearish breaker blocks
• More bearish breakers = More resistance zones above
Bias Indicator [/b>
• ⬆ Bullish: More bullish breakers (support > resistance)
• ⬇ Bearish: More bearish breakers (resistance > support)
• ↔ Neutral: Equal breakers on both sides
Near Indicator
• Shows nearest active breaker and distance
• Example: "Bull BB -1.5%" = Bullish breaker 1.5% below price
━━━━━━━━━━━━━━━━━━━━━━━━━━━━
📱 Alert Setup
This indicator includes 2 alert types:
1. Price Entering Bullish Breaker [/b>
• Fires when price touches bullish breaker block
• Action: Watch for bounce/support
2. Price Entering Bearish Breaker
• Fires when price touches bearish breaker block
• Action: Watch for rejection/resistance
To Set Up Alerts:
1. Click "Alert" button (clock icon)
2. Select "Breaker Blocks"
3. Choose alert type
4. Configure notifications
5. Click "Create"
━━━━━━━━━━━━━━━━━━━━━━━━━━━━
💎 Pro Tips & Best Practices
✅ DO:
• Wait for confirmation before entering at breakers
• First touch of breaker has highest reliability
• Use breakers with trend direction for best results
• Combine with order blocks and FVGs for confluence
• Check multiple timeframes for breaker alignment
• Respect breakers - they're stronger than regular S/R
• Use proper stop placement beyond the breaker
⚠️ DON'T:
• Don't trade every breaker - quality over quantity
• Don't ignore breaker breaks - very strong momentum signal
• Don't use tight stops - allow room for wicks
• Don't expect all breakers to hold
• Don't trade against strong momentum through breakers
• Don't confuse breakers with regular order blocks
🎯 Best Timeframes:
• Scalping: 5min, 15min (quick breaker tests)
• Day Trading: 15min, 1H (balanced)
• Swing Trading: 1H, 4H, Daily (major breakers)
🔥 Best Markets:
• Excellent: BTC, ETH, Forex majors, ES, NQ
• Good: Gold, Oil, Major indices
• Note: Breakers need volatility to form
━━━━━━━━━━━━━━━━━━━━━━━━━━━━
🎓 Advanced Concepts
Breaker Strength Hierarchy
From weakest to strongest:
1. Support/Resistance lines
2. Order Blocks (unbroken)
3. Breaker Blocks (broken OBs) ← Often strongest
4. Multiple breakers stacked together
Breaker vs Order Block Priority
If breaker and order block overlap:
• Breaker takes precedence
• Failed levels are more significant
• Price respects breakers more reliably
Nested Breakers [/b>
When lower timeframe breaker exists within higher timeframe breaker:
• Trade lower TF breaker first
• Use higher TF breaker as final target
• Highest probability setups
Multiple Breaker Tests [/b>
• First test: Highest probability
• Second test: Still valid but weaker
• Third test: Likely to break through
Breaker Breakouts [/b>
When price breaks through breaker:
• Extremely strong momentum signal
• Old level completely invalidated
• Trade the breakout aggressively
━━━━━━━━━━━━━━━━━━━━━━━━━━━━
📈 Common Patterns [/b>
Pattern 1: The Perfect Flip
• Bearish OB forms
• Price breaks above it cleanly
• Becomes bullish breaker
• First retest bounces perfectly
• High-probability setup
Pattern 2: The Double Break
• Bullish OB breaks down (becomes bearish breaker)
• Price tests it and rejects
• Later breaks back up through breaker
• Very strong momentum signal
Pattern 3: The Breaker Ladder [/b>
• Multiple breakers stacked like stairs
• Price bounces from one to next
• Each breaker provides support/resistance
Pattern 4: The Failed Breaker
• Breaker forms but gets broken immediately
• Shows extreme momentum
• Don't fight it - trade the breakout
━━━━━━━━━━━━━━━━━━━━━━━━━━━━
🙏 If You Find This Helpful
• ⭐ Leave your feedback
• 💬 Share your experience in the comments
• 🔔 Follow for updates and new tools
Questions about breaker blocks? Feel free to ask in the comments.
━━━━━━━━━━━━━━━━━━━━━━━━━━━━
Version History [/b>
• v1.0 - Initial release with auto-timeframe detection and polarity flip tracking

Trading Playbook Panel (SMC + EW + Sniper)🔥 What This Script Does
The indicator creates a visual floating panel containing:
1. HTF Bias Framework (H4 → H1 → M15)
Guides you through determining trend, liquidity direction, imbalance zones, and institutional order flow.
2. Valid Setup Models
Covers both:
Continuation setups (displacement → OTE → FVG entry)
Reversal setups (liquidity sweep → CHoCH → retest)
3. 5-Minute Sniper Entry Checklist
Ensures high-precision entries with:
Liquidity sweep
CHoCH
Displacement
FVG formation
Retest entry
Strict invalidation rules
This is the exact logic used in prop-firm and institutional trading models.
4. Stop-Loss & Invalidation Rules
Built with institutional logic:
SL beyond liquidity sweep
SL beyond invalidation swing
Works for both BUY and SELL setups.
5. Multi-Stage Take Profit Mapping
Including:
Internal liquidity
Equal highs/lows
Imbalance
Opposite OB
HTF draw
Designed for partials + runners.
6. Risk-Management System
A complete discipline structure:
0.5–2% risk per setup
Max daily loss
Max trades per day
Stop-after-loss rule
No chasing / no mid-range entries
7. Pre-Trade Checklist
A professional assessment framework to verify trade quality.
8. Trading Psychology Principles
Reinforces mindset, discipline, and patience.
⭐ Who This Script Is For
This tool is ideal for:
SMC traders
ICT style traders
Elliott Wave traders
Scalpers & intraday traders
Prop-firm challengers
Anyone wanting to follow a repeatable, rules-based system
It keeps you consistent, structured, and focused on the highest-probability setups.
🧠 Why This Script Works
Most traders lose because they:
Enter impulsively
Skip rules
Don’t analyze multi-timeframe structure
Enter without liquidity confirmation
Use random entry zones
This script eliminates that.
It forces a clear, step-by-step process:
1️⃣ Top-down bias
2️⃣ Liquidity location
3️⃣ Sweep → CHoCH → Displacement
4️⃣ Refined 5M entry
5️⃣ Strict SL & TP rules
It removes emotion and replaces it with pure process.
⚙️ Customizable
Move the panel anywhere on the chart
Change panel colors
Change text colors
Perfect for dark or light mode
🎯 Summary
This is not a trading signal indicator.
This is your rulebook, your discipline engine, and your playbook — right on your chart.
It keeps you aligned with the highest-probability setups used by advanced SMC and EW traders.
Use it before every trade.
Trade like a professional — every day.

DR/IDR Break .5 TPDR/IDR Extension Breakout with Custom Stop
This strategy is a systematic, counter-trend, and momentum-based system designed for intraday trading. It operates on the principle of an Opening Range Breakout (ORB), utilizing the initial market consolidation to project high-probability targets, while offering multiple methods for managing risk.
1. Market Identification (The Opening Range)
The strategy begins by defining the market's initial boundaries and volatility:
Session Window: The strategy calculates the Opening Range (OR) over a user-defined time period (default: 9:30 AM to 10:30 AM New York Time).
ORB Levels: Two key price levels are established and locked once the time window closes:
Wick High/Low: The absolute highest and lowest prices of the session. These serve as the entry trigger lines.
Body High/Low (Shaded Range): The highest and lowest open/close prices of the session. The height of this range is used to calculate the Take Profit and Stop Loss levels.
2. Entry Rule (The Breakout)
The strategy is passive until the range is violated, looking for a strong move out of the consolidation area.
Trigger Condition: A trade is signaled when a candle closes either:
Above the Wick High (for a Long entry).
Below the Wick Low (for a Short entry).
Execution: The entry is a Market Order executed on the candle that meets the trigger condition, subject to a user-defined Entry Delay (default 0 bars, meaning the entry is taken immediately upon the breakout candle's close).
Direction Control: The user can select to trade Long Only, Short Only, or Both.
3. Exit and Risk Management
All trades are placed with simultaneous Take Profit and Stop Loss orders (a bracket order) once the entry is filled.
A. Take Profit (TP)
The Take Profit is set at the 0.5 Extension of the Shaded Range (Body Range).
Calculation: The distance from the Body High/Low to the TP level is exactly 50% of the total height of the Shaded Range.
B. Stop Loss (SL)
The Stop Loss is dynamically calculated based on a user-selected method for risk control:
Range 0.5 (Body Range): The Stop Loss is placed an equal distance (0.5 times the Body Range height) outside the opposite side of the Body Range.
Example (Long): If entry is above the Wick High, the SL is set 0.5 times the Body Range height below the Body Low.
ATR Multiple: The Stop Loss distance is determined by the asset's recent volatility.
Calculation: The distance is calculated as a user-defined Multiplier (default 2.0) times the Average True Range (ATR).
Recent Swing Low/High: The Stop Loss is placed based on a structural level defined by recent price action.
Long Entry: SL is placed at the Lowest Swing Low within a user-defined lookback period.
Short Entry: SL is placed at the Highest Swing High within a user-defined lookback period.
Summary of Workflow
The market sets the Wick and Body boundaries (e.g., 9:30–10:30 AM).
Price breaks and closes beyond a Wick boundary, triggering a signal.
The trade enters after the specified delay.
A bracket order is placed: TP is fixed at the 0.5 Extension, and SL is set based on the user's chosen risk method.
The trade is closed upon reaching either the TP or the SL level.

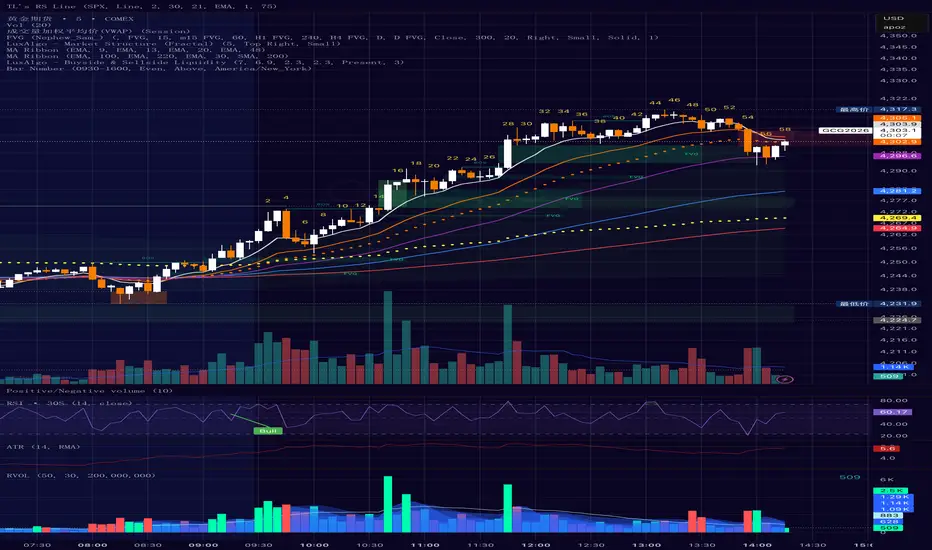
Bar Number IndicatorBar Number Indicator
This Pine Script indicator is designed to help intraday traders by automatically numbering candlesticks within a user-defined trading session. This is particularly useful for strategies that rely on specific bar counts (e.g., tracking the 1st, 18th, or 81st bar of the day).
Key Features:
Session-Based Counting: Automatically resets the count at the start of each new session (default 09:30 - 16:00).
Timezone Flexibility: Includes a dropdown to select your specific trading timezone (e.g., America/New_York), ensuring accurate session start times regardless of your local time or the exchange's default setting.
Smart Display Modes: Choose to show "All" numbers, or filter for "Odd" / "Even" numbers to keep your chart clean.
Custom Positioning: Easily place the numbers Above or Below the candlesticks.
Minimalist Design: Numbers are displayed as floating text without distracting background bubbles.
Dynamische Open/Close Levels mit Historie🎯 Key Features
This indicator provides clean, configurable horizontal lines showing the Open and Close prices of a higher chosen timeframe (e.g., the last 5-minute candle), serving as dynamic support and resistance levels.
Unlike traditional indicators that draw messy "steps" across your entire chart, this tool is designed for clarity and precise control.
Controlled History: Easily define how many of the last completed periods (e.g., 5-minute blocks) should remain visible on the chart. Set to 0 for only the current, active levels.
No Stepladder Effect: Uses advanced drawing methods (line.new and object management) to ensure the historical levels remain static and do not clutter your chart history.
Dynamic Labels: The labels (e.g., "Open (5)") automatically adjust to show the timeframe you configured in the indicator settings, eliminating confusion when switching timeframes.
Customizable: Full control over colors, line length, and label positioning/size.
💡 Ideal Use Case
Perfect for scalpers and day traders operating on lower timeframes (1m, 3m) who want to quickly visualize and respect crucial price action levels from a higher context (e.g., 5m, 15m, 1h).

Entry Scanner Conservative Option AKeeping it simple,
Trend,
RSI,
Stoch RSI,
MACD, checked.
Do not have entry where there is noise on selection, look for cluster of same entry signals.
If you can show enough discipline, you will be profitable.
CT

ADX Indicator with VisualADX Indicator with line and clear number. Identifies when ADX Index is weak, trending, or strong. Depending on timeframe, this indicator can be used to identify early signs of a change in trend.
This is my first time creating an indicator and coding, so please, use it at your own discretion. If anyone has any helpful suggestions, please leave a comment. I can email you the source code so you can revise it. In return, I ask that you share the updated code with me so everyone that uses this indicator can benefit. Thank you! :)

FVG vertical Created by Alphaomega18
🎯 What is an FVG (Fair Value Gap)?
A Fair Value Gap is a price imbalance created by a mismatch between buyers and sellers, formed by 3 consecutive candles where:
Bullish FVG: The low of the current candle is above the high of the candle 2 periods ago
Bearish FVG: The high of the current candle is below the low of the candle 2 periods ago
⚙️ Indicator Settings
Display Group:
Show Bullish vertical FVG: Display bullish vertical FVGs (green) ✅
Show Bearish vertical FVG: Display bearish vertical FVGs (red) ✅
Box Extension (bars): Zone extension duration (1-50 bars, default: 10)
Show Labels: Display labels with gap size 🏷️
Remove When Filled: Automatically remove filled zones ✅
📊 Visual Elements
FVG Zones:
🟢 Green = Bullish vertical FVG (potential support zone)
🔴 Red = Bearish vertical FVG (potential resistance zone)
Labels:
Show gap size in points
Positioned at the beginning of each zone
Dashboard (top right corner):
Real-time count of active FVGs
🟢 = Number of bullish vertical FVGs
🔴 = Number of bearish vertical FVGs
Candle Coloring:
Light green background = Candle forming a bullish vertical FVG
Light red background = Candle forming a bearish vertical FVG
🎯 How to Use the Indicator
1. Installation:
Open TradingView
Click "Indicators" at the top of the chart
Search for "FVG Clean" or paste the code in the Pine Editor
2. Trading Strategies:
Support/Resistance:
Bullish vertical FVGs act as support zones
Bearish vertical FVGs act as resistance zones
Price tends to return to "fill" these gaps
Position Entries:
Long: Wait for a return to a bullish vertical FVG + confirmation
Short: Wait for a return to a bearish vertical FVG + confirmation
Position Management:
Place stops below/above FVGs
Use FVGs as price targets
A filled FVG loses its validity
🔔 Alerts
The indicator includes 2 configurable alert types:
Bullish vertical FVG: Triggers when a new bullish vertical FVG forms
Bearish vertical FVG: Triggers when a new bearish vertical FVG forms
To configure: Right-click on chart → "Add Alert" → Select desired alert
💡 Usage Tips
✅ Do:
Combine with other indicators (volume, momentum)
Wait for confirmation before entering
Use across multiple timeframes
Respect your risk management
❌ Don't:
Trade solely on FVGs without confirmation
Ignore the overall market trend
Overload your chart with too many zones
🔧 Parameter Optimization
Scalping (1-5min):
Box Extension: 5-10 bars
Remove When Filled: Enabled
Day Trading (15min-1H):
Box Extension: 10-20 bars
Remove When Filled: Enabled
Swing Trading (4H-Daily):
Box Extension: 20-50 bars
Remove When Filled: As preferred
📈 Performance
Maximum 100 FVGs of each type in memory
Automatic removal of oldest ones
Optimized to not slow down your chart
Compatible with all markets and timeframes

Multi-MA + RSI Pullback Strategy (Jordan)1️⃣ Strategy logic I’ll code
From your screenshots:
Indicators
• EMAs: 600 / 200 / 100 / 50
• RSI: length 6, levels 80 / 20
Rules (simplified so a script can handle them):
• Use a higher-timeframe trend filter (15m or 1h) using the EMAs.
• Take entries on the chart timeframe (you can use 1m or 5m).
• Long:
• Higher-TF trend is up.
• Price is pulling back into a zone (between 50 EMA and 100 EMA on the entry timeframe – this approximates your 50–61% retrace).
• RSI crosses below 20 (oversold).
• Short:
• Higher-TF trend is down.
• Price pulls back between 50 & 100 EMAs.
• RSI crosses above 80 (overbought).
• Exits: ATR-based stop + take-profit with adjustable R:R (2:1 or 3:1).
• Max 4 trades per day.
News filter & “only trade gold” you handle manually (run it on XAUUSD and avoid news times yourself – TradingView can’t read the economic calendar from code).

Trend Exhaustion Strategy [9,13]
** **
**Overview**
Trend Exhaustion Strategy is a specialized market timing tool designed to identify potential trend fatigue and price reversals. Based on classic 9-13 market timing logic, this indicator introduces a unique **Dynamic Support & Resistance Engine**.
Unlike standard counters, this script automatically projects active support and resistance levels from completed pattern phases. These lines serve as critical reference zones for trade management.
**Key Features**
* **Trend Exhaustion Detection:** Identifies potential market turning points using a two-phase structure:
* **Setup 9:** Highlights short-term momentum pauses.
* **Extension 13 (Phase 2):** Signals longer-term trend depletion and high-probability reversal zones.
* **Dynamic Extension Lines:**
* When a Setup 9 or Extension 13 completes, a horizontal level is instantly generated.
* **Resistance Lines (Red):** Generated at Tops.
* **Support Lines (Green):** Generated at Bottoms.
* **Smart Collision Detection:** The lines automatically extend to the right and terminate only when the price "collides" with or invalidates them.
**How to Use**
1. **Reversal Signals:** Look for the triangle icons (Setup 9) and labels (S13/B13). These often precede a pause or reversal.
2. **Breakout/Bounce Play:**
* Price approaches **Red Line** from below: Watch for rejection (Short).
* Price approaches **Green Line** from above: Watch for bounce (Long).
**Settings**
* **Recycle Mechanism:** Option to restart the count if specific conditions are met.
* **Visual Customization:** Fully adjustable line styles and colors.
-----
** **
**概述**
Trend Exhaustion Strategy (趋势耗尽策略) 是一款市场择时工具,旨在识别趋势疲劳和潜在的价格反转。本指标基于经典的 9-13 市场择时逻辑,并引入了独特的**动态支撑/阻力引擎**。
与普通计数器不同,该脚本会从完成的形态阶段自动生成有效的支撑和阻力线,为交易提供关键参考。
**核心功能**
* **趋势耗尽检测:** 使用双阶段结构识别市场转折点:
* **Setup 9:** 提示短期动能暂停。
* **Extension 13 (第二阶段):** 提示更长周期的趋势衰竭和高概率反转区。
* **动态延伸线:**
* 当 Setup 9 或 Extension 13 完成时,立即生成水平线。
* **阻力线(红色):** 在顶部生成。
* **支撑线(绿色):** 在底部生成。
* **智能碰撞检测:** 线段自动向右延伸,只有当价格触碰或突破它们时才会终止。
**使用方法**
1. **反转信号:** 观察三角形图标(Setup 9)和标签(S13/B13)。
2. **突破/反弹交易:** 价格接近红线看跌,接近绿线看涨。

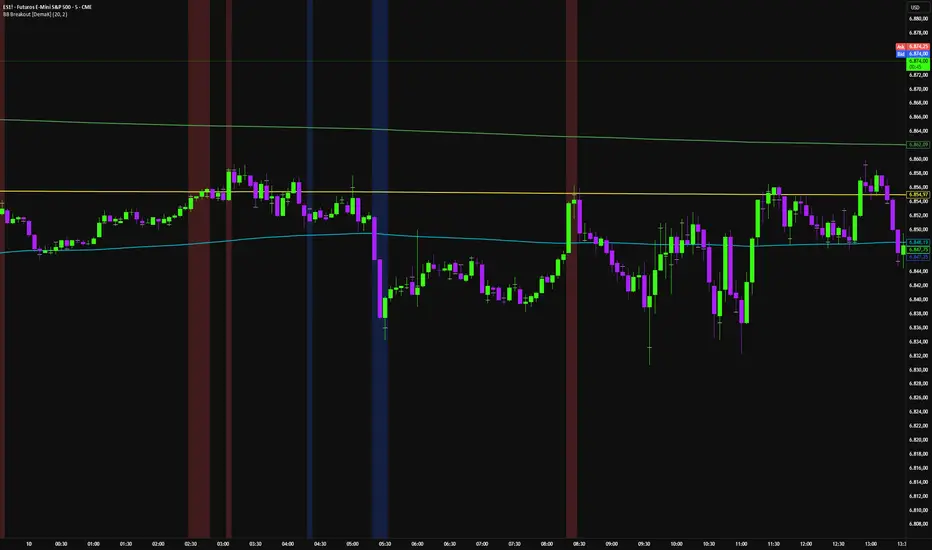
SWING [DEMAK]SWING
EMA 5, 25, 50, 200, 250
SMA 10
Indicator for finding swing trades and reading direction
STOCKS / CRYPTO / FUTURES

ATR + True RangeOne indicator for ATR & TR its a common indictor which can be used as one
instead of 2 different its is trial mode only not to be used with out other references