Money Heist - NRP V2⏳ Note - Check on different time frame
Multi-Timeframe Entry Logic
The strategy derives its core signals from a higher timeframe (18 times the current chart resolution) using synthetic price data, aiming to filter out noise.Higher Timeframe (HTF): $18 \times$ current chart resolution.Trend Filter: Simplified RSI(7) is included, but currently set to always pass (RSI > 0).Backtesting Filter: Allows the user to restrict trading to a specific date range.
'Open/Close' Mode (Heikin Ashi-based)
Data Source: Heikin Ashi candles from the HTF.
Long Entry: HTF Heikin Ashi Close crosses over Open.
Short Entry: HTF Heikin Ashi Close crosses under Open.
Renko' Mode (EMA Cross-based)
Data Source: Renko blocks (ATR-based) from the HTF.
Long Entry: Fast EMA(2) crosses over Slow EMA(10) on the HTF Renko bars.
Short Entry: Fast EMA(2) crosses under Slow EMA(10) on the HTF Renko bars.
Trade Shifting Mechanism (Reversal Logic)
This is a key feature that makes the strategy aggressive in capturing reversals:
Detection: After any trade is successfully closed (due to TP, SL, or reversal), the strategy checks if it was a Long exit or a Short exit.
Delayed Entry Flag: A flag (delayedLongEntry or delayedShortEntry) is immediately set for the opposite direction.
Execution: This flag allows the strategy to enter the opposite trade on the next confirmed bar without needing a new, full-fledged signal from the primary entry logic, facilitating quick position flipping.
チャートパターン

Trendline365 Delta V2025 (Fixa)The Trendline365 Delta is an advanced structural-reading indicator that combines multiple layers of fixed moving averages, organized by color, to reveal the real dynamics of the trend across different time horizons. It does not attempt to predict the market — instead, it accurately describes how the trend is behaving right now, allowing traders to identify acceleration, weakness, transitions, and decision points that usually go unnoticed.
The indicator is divided into color-coded bands:
Red Series → Represents ultra-short-term momentum. It serves as an immediate thermometer of strength or weakness, ideal for validating early moves and shallow pullbacks.
Yellow Series → Captures the intermediate trend. This zone acts as a powerful filter to avoid rushed entries and highlights deeper corrections within a larger trend.
Green Series → Shows the macro structure of the trend. When price consistently stays above or below this band, a clear primary direction is established.
Blue Series → The classic institutional axis, the most widely used global reference to evaluate bull markets and bear markets.
Long Blue Series → Represents the extreme long-term trend. A “gravitational floor” that only shifts when entire market cycles reverse.
In addition to the moving averages, the indicator includes a 20-period Volume Moving Average, allowing the trader to evaluate the strength behind price movements. The combination of structure (moving averages) and energy (volume) provides a clear reading of continuation, exhaustion, true breakouts, and fake breakouts.
How to use it in practice
Strong trend: price above the red/yellow bands, upward alignment, and sustained volume.
Transition: when price begins crossing from one colored band to another, especially if volume divergence is present.
Healthy corrections: low-volume pullbacks into the red/yellow zones.
Cycle change: breakouts of the green band or the 200-period level with increasing volume.
The Trendline365 Delta simplifies trend analysis and transforms the chart into an intuitive visual map, ideal for swing traders, position traders, and content creators who want to explain the market with clarity and authority.

PSAR with EMA FilterThis indicator combines the Parabolic SAR (PSAR) with an EMA trend filter to generate more accurate trend-following signals.
PSAR helps identify potential trend reversals and trailing stop levels, while the EMA ensures that trades are aligned with the overall market direction.

MACD with EMA FilterThis indicator combines the MACD (Moving Average Convergence Divergence) with an EMA-based trend filter to improve the quality of entry signals.
MACD identifies changes in momentum and potential trend reversals, while the EMA ensures that signals are taken only in the direction of the broader trend.

RSI with EMA FilterThis indicator combines the Relative Strength Index (RSI) with a trend-filtering Exponential Moving Average (EMA) to generate higher-quality momentum signals.
RSI identifies overbought and oversold market conditions, while the EMA confirms the overall trend direction, helping traders avoid false signals in choppy markets.

C3 Pattern Trigger-DhirenFawxThis indicator is a highly streamlined and immediate signal generator based on a specific 3-Candle (3C) pattern used to quickly identify potential demand and supply exhaustion points.
Unlike traditional zone-based indicators that wait for a price breakout after the pattern forms, the 3C Pattern Trigger signals the moment the pattern completes, offering an early entry/alert opportunity.
Connect - DhirenFawx

ICT | SMC [Sky Eye] 體驗版12/15體驗版12/15
DC: discord.gg/8kE8XwmErc
輔助 SMC 位子畫線 幫助你加速學習
只需要知道這個位子是甚麼在去加強研究 ICT / SMC 即可
想學習更多可以到DC一起學習
DC: discord.gg/8kE8XwmErc
This tool helps you draw lines to indicate SMC positions, accelerating your learning.
You only need to know what each position represents before focusing your research on ICT/SMC.
To learn more, join us at DC.

Sky Eye AI 體驗版至12/15體驗版至12/15
DC: discord.gg/8kE8XwmErc
輔助 規劃進出場 位子畫線 幫助你加速學習
只需要知道這個位子是甚麼在去加強研究 技術分析 即可
想學習更多可以到DC一起學習
DC: discord.gg/8kE8XwmErc
Assisted with entry and exit point planning and position drawing to accelerate your learning.
You only need to know what this position represents before you can further study and analyze technical indicators.
To learn more, you can join us at DC

Sky Eye Oscillator 中文版 [Sky Eye]DC: discord.gg
輔助 判斷RSI KDJ 量能 幫助你加速學習
只需要知道這個位子是甚麼在去加強研究 技術分析 即可
想學習更多可以到DC一起學習
DC: discord.gg
Assists in judging RSI, KDJ, and volume to help you learn faster.
Just know what this position represents before you can further study technical analysis.
Want to learn more? Join DC for more learning opportunities.

Sky Eye TRADE AI DC: discord.gg
輔助 規劃進出場 位子畫線 幫助你加速學習
只需要知道這個位子是甚麼在去加強研究 技術分析 即可
想學習更多可以到DC一起學習
DC: discord.gg
Assisted with entry and exit point planning and position drawing to accelerate your learning.
You only need to know what this position represents before you can further study and analyze technical indicators.
To learn more, you can join us at DC.

ICT | SMC 工具箱 [Sky Eye]DC: discord.gg
輔助 SMC 位子畫線 幫助你加速學習
只需要知道這個位子是甚麼在去加強研究 ICT / SMC 即可
想學習更多可以到DC一起學習
DC: discord.gg
This tool helps you draw lines to indicate SMC positions, accelerating your learning.
You only need to know what each position represents before focusing your research on ICT/SMC.
To learn more, join us at DC.

Casper 5min candle v0.6--------------------------------------------
Description
--------------------------------------------
This is an indicator showing trade ideas and alerts based on
5minute Candle breakout strategy according to www.youtube.com
BASIC FUNCTIONS
- it draws 5 min Range (default 9:30 NY time at Stock market open)
- detects breakout of range with fvg_tap_wait
- wait for tapping FVG
- waits for entry confirmation
- it has sets of alerts (FVG creation, FVG tapping and Entry confirmation)

FVG IFVG DetectorThe FVG IFVG Detector is a market–structure-based indicator designed to automatically detect Fair Value Gaps (FVGs) and Inversion Fair Value Gaps (IFVGs) on any timeframe. It highlights these imbalances as extended zones on the chart, helping traders identify areas where price has moved inefficiently and is likely to revisit.
Below is the detailed breakdown of what the indicator does:
1. Detects Bullish and Bearish Fair Value Gaps (FVGs)
The indicator checks for the standard 3-candle FVG structure:
Bullish FVG
Formed when high of candle (n-2) is below low of candle (n)
Indicates price moved upward too fast, leaving an imbalance below.
Bearish FVG
Formed when low of candle (n-2) is above high of candle (n)
Indicates price moved downward too fast, leaving an imbalance above.
2. Detects IFVG (Inversion Fair Value Gaps)
IFVG forms when an FVG is later retested and price reacts opposite its origin.
Bullish IFVG
A bullish FVG is created
Price returns and taps the upper boundary
The candle closes bullish (close > open)
The zone becomes a support-like inversion area
Bearish IFVG
A bearish FVG is created
Price returns and taps the lower boundary
The candle closes bearish (close < open)
The zone becomes a resistance-like inversion area
3. Draws IFVG Zones Extended to the Right
The indicator plots:
A top line
A bottom line
A filled area between the two lines
The zone extends indefinitely to the right, acting like supply/demand imbalance levels.
This makes it visually clear where price may react again in the future.
4. Separate Maximum Counts for Bullish & Bearish IFVGs
User can define:
How many bullish IFVG zones should be displayed
How many bearish IFVG zones should be displayed
Older zones are automatically removed to keep the chart clean.
5. Clean Visuals — No Labels, No Clutter
The indicator intentionally avoids:
Labels
Markers
Text overlays
Only clean, extended imbalance zones are shown for a professional SMC-style chart.
6. Fully Compatible with Any Timeframe
Works on:
Scalping (M1–M15)
Intraday (M30–H1)
Swing (H4–Daily)
The logic stays the same across all chart speeds.
7. Practical Use Cases for Traders
The indicator helps identify:
Areas where price is likely to return, react, or mitigate
Entries based on retest of imbalance
Potential zones for reversal, continuation, or trend confirmation
8. Advantages for SMC Traders
Automatically highlights hidden inefficiencies
Helps anticipate reversal zones
Filters low-quality imbalances
Provides structure-aligned entries
Reduces chart noise
Improves consistency in finding Smart Money levels

Volume Profile Key LevelsVolume Profile Key Levels (VP Lvls)
Overview
A comprehensive Volume Profile indicator that automatically calculates and displays key volume-based support/resistance levels including POC (Point of Control), VAH (Value Area High), VAL (Value Area Low), and LVN (Low Volume Nodes) zones.
The indicator uses a fixed 500-row resolution and time-based lookback, ensuring consistent levels across all timeframes (1m, 5m, 15m, 1H, etc.).
Key Features
📊 Volume Profile Levels
POC (Point of Control) - Price level with the highest traded volume (yellow solid line)
VAH (Value Area High) - Upper boundary of the value area (red dashed line)
VAL (Value Area Low) - Lower boundary of the value area (green dashed line)
Value Area - Configurable percentage (default 68%) where most trading activity occurred
🔵 Low Volume Node (LVN) Detection
Automatically identifies price zones with significantly lower volume - areas where price tends to move quickly through. LVNs are marked as blue boxes on the chart.
Smart LVN Detection uses:
Relative comparison to local average volume
Relative comparison to local peak volume
Absolute floor check to prevent false positives in value areas
📈 Volume Histogram
Visual representation of volume distribution at each price level:
Orange - Inside Value Area
Teal - Outside Value Area
Yellow - POC level
Settings
Volume Profile Settings
SettingDefaultDescriptionNumber of Days3Lookback period for volume calculationValue Area %68Percentage of volume to include in value area
LVN Detection
SettingDefaultDescriptionLVN Threshold %80Mark as LVN if below this % of local averageLVN Peak Threshold %60Also mark as LVN if below this % of local peakLVN Absolute Max %40Must be below this % of POC (prevents false positives)LVN Comparison Window10Number of rows above/below to compareMin LVN Width2Minimum rows to form an LVN zoneMax LVN Zones25Maximum number of LVN zones to display
Display Settings
SettingDefaultDescriptionShow POC/VAH/VAL✓Toggle individual level visibilityShow Histogram✓Toggle volume histogramShow LVN Boxes✓Toggle LVN zone boxesHistogram Width50Width of histogram barsExtend Lines20Bars to extend lines into the future
How to Use
For Support/Resistance
POC acts as a strong magnet - price often returns to POC
VAH/VAL serve as value area boundaries - breakouts beyond these levels can signal trend continuation
LVN zones are areas of low acceptance - price moves quickly through these, making them potential breakout/breakdown zones
For Entry/Exit
Look for entries near POC, VAL, or VAH with confirmation
Use LVN zones as potential targets - price often accelerates through these areas
VAH rejection = potential short, VAL rejection = potential long
Multi-Timeframe Analysis
The indicator displays identical levels across all timeframes when using the same settings. This allows you to:
Identify levels on higher timeframes
Fine-tune entries on lower timeframes
Confirm confluence across multiple timeframes
Alerts
Built-in alert conditions for:
Price crossing POC
Price crossing VAH
Price crossing VAL
Technical Notes
Uses 500 fixed rows for high-resolution profile
Auto-calculates row size based on price range
Maximum 4000 bars lookback (Pine Script limitation)
Optimized for performance with smart box management
Recommended Settings by Asset
Gold (XAUUSD)
Days: 30, LVN Threshold: 80%, Peak: 60%, Absolute: 40%
Forex Majors
Days: 5-10, LVN Threshold: 75%, Peak: 55%, Absolute: 35%
Crypto (BTC/ETH)
Days: 7-14, LVN Threshold: 80%, Peak: 60%, Absolute: 40%
Indices (US30, NAS100)
Days: 20-30, LVN Threshold: 80%, Peak: 60%, Absolute: 40%
Changelog
v1.0
Initial release
POC, VAH, VAL calculation
Smart LVN detection with triple-check system
Volume histogram visualization
Multi-timeframe consistency
Production-safe code with comprehensive error handling
This indicator is for educational purposes only. Always use proper risk management and combine with other analysis methods.

Jerry's TrueDay Opening Ranges & H/L'sClick around. True Day H12 opening on Weekly and above, and H1 Attempted Direction Range on Daily.

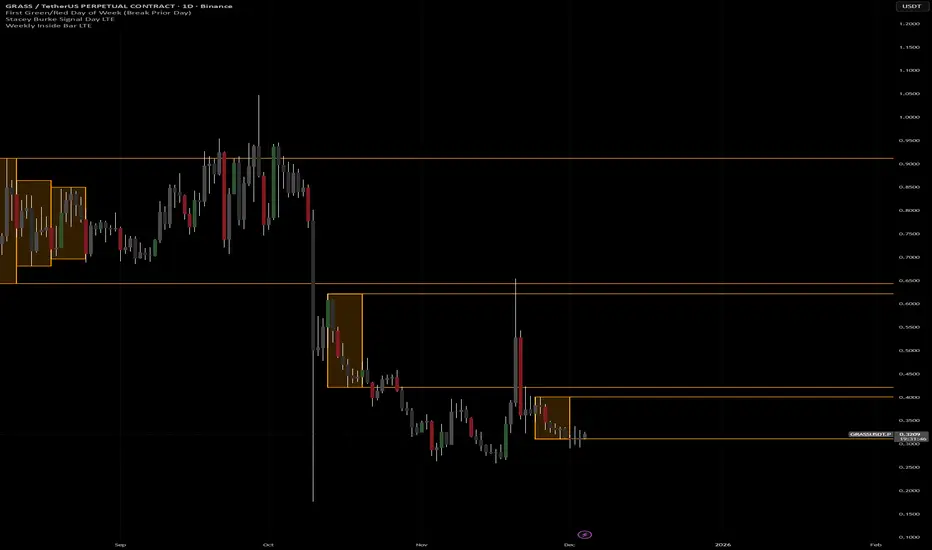
Weekly Inside Bar LTEShows weekly inside bar on lower timeframes so you can create breakout and failure zones

Prowl's EMA 10/20/50 trend followingThis indicator is designed to simplify trend trading by visually filtering market noise. It removes the need to constantly analyze multiple moving average crossovers by converting complex trend alignment into a simple "Traffic Light" background system.
How it Works This script utilizes a triple-EMA (Exponential Moving Average) system to gauge market conditions on two levels:
Momentum: It analyzes the relationship between the Fast and Medium EMAs to determine immediate short-term momentum.
Trend Filter: It compares the current price action against a Slow (Baseline) EMA to ensure the major trend is respected.
Visual Guide
Green Background: This indicates a "High Probability Buy Zone." It only triggers when both the short-term momentum is positive (Fast EMA ≥ Medium EMA) AND the price is maintaining its structure above the long-term baseline (Price ≥ Trend EMA).
Red Background: Indicates neutral or bearish conditions where the trend alignment is broken.
The Lines:
Red Line: Fast EMA (Short-term reaction)
Orange Line: Medium EMA (Intermediate trend)
Green Line: Trend EMA (Long-term baseline)
Features
Visual Simplicity: The background color allows you to instantly see if the trend is in your favor without cluttering your mental space.
Fully Customizable: All EMA lengths are adjustable in the settings to fit your specific timeframe (Scalping vs. Swing Trading).
Gradient Colors: The lines are color-coded (Red to Green) to visually represent the time horizon.
Adjustable Opacity: Users can control the intensity of the background color to keep their charts clean.
Usage Strategy This tool is best used as a "Trend Filter." Traders can look for their specific entry setups (candlestick patterns, breakouts, etc.) only when the background is Green, and stand aside or look for shorts when the background is Red.

Jerry's True-Open Opening-Ranges and High and Low MarkerShows the UTC Open for Sessions of (Yearly Monthly Weekly) levels, and their corresponding first 12 Hours of price trading as a broader level. Can toggle amount of previous sessions shown, their highs and lows of the session, sessions with shorthand labels, and level's labels (hopefully) overlapping. Can bring the last immediate session up to where price and time is currently.
On the Daily section, marks every 24 hours, the attempted direction in the first hour of price. With all the same logic.
Just take a look. TLDR like spaceman's but a bit different.

Institutional S/R Engine + Major FX Scanner v2.1This indicator is designed to map out institutional-style Support & Resistance zones and rank them by strength, so you can immediately see which areas on the chart actually matter.
Instead of drawing random horizontal lines, it automatically detects swing points, builds zones, and scores them based on how price has reacted there in the past. The goal is simple:
Help you focus on the most meaningful levels for entries, partials, and take-profit targets.
What it does
Auto-detects Support & Resistance zones
Uses swing structure to find major highs/lows and converts them into zones instead of thin lines, so you see “areas of interest,” not single magic prices.
Macro + Micro structure in one view
Separates higher-timeframe structure (macro) from local intraday structure (micro), letting you see the bigger picture and the immediate battle zone at the same time.
Zone strength scoring
Each zone is graded using factors such as:
Number of respected touches / reactions
How recently price interacted with the zone
How cleanly price reversed or continued from that level
Stronger zones are visually emphasized so your eye is drawn to the most important areas first.
ATR-aware zone widths
Zone size adapts to volatility, so levels don’t become absurdly thick in fast markets or razor-thin in slow ones. This helps keep zones realistic and tradable.
Clean, minimal visuals
Zones are plotted with clear colors and opacity so they are easy to see without cluttering your chart. You can tune transparency, line styles, and how many zones you want to see.
How to use it
This script is meant to be a decision-support tool, not a signal generator:
Use the strongest zones as:
Locations to plan trend continuation entries
Areas to look for exhaustion / fade behavior
Logical places for partials or final take-profit targets
Combine the zones with:
Your EMA stack or moving average framework
Volume / volatility tools
Candlestick behavior and market structure (HH/HL, LH/LL, breaks of structure)
The edge comes from confluence: strong zone + correct bias + clean price action.
The script will not tell you “buy” or “sell” – it shows you where the fight is most likely to matter.
Markets & Timeframes
Works on Forex, indices, commodities, crypto, and futures.
Timeframe-agnostic: can be used on higher timeframes for swing context and on intraday charts for execution.
Important note
This is an analytical tool only. It does not guarantee profit, and it is not financial advice. Always combine it with your own risk management, trade plan, and backtesting before using it in live markets.

KENW Liq Sweep 17This indicator is designed to alert on potential liquidity sweep events:
- In uptrends, it tracks Sell-Side Liquidity (SSL) by marking swing lows that occur during negative MACD histogram periods. It generates a long entry alert when price makes a lower low in SSL (i.e., the most recent SSL level is below the prior one), suggesting a sweep of sell-side liquidity before a potential bullish continuation.
- In downtrends, it tracks Buy-Side Liquidity (BSL) by marking swing highs that occur during positive MACD histogram periods. It generates a short entry alert when price makes a higher high in BSL (i.e., the most recent BSL level is above the prior one), indicating a sweep of buy-side liquidity before a potential bearish continuation.

Previous Day High / Low / EquilibriumThis indicator plots Previous Day High (PDH), Previous Day Low (PDL), and Previous Day Equilibrium (PD-EQ) anchored to the candles that formed these levels.
🔥 Key Features
Candle-Anchored Levels
PDH/PDL aren’t placed at the midnight candle or the daily bar open. They’re anchored to the actual intraday candle that made the previous day’s high or low.
Session-Aware (17:00 or 18:00 NY)
Set your preferred daily session open (17:00 for Forex, 18:00 for indices/futures) for correct cross-timeframe behavior, including Daily and H4.
Dynamic Line Extension
Lines extend only up to the current candle
Adjustable Line Styles
Choose between Solid, Dashed, or Dotted lines for PDH, PDL, and PD-EQ.
⚙️ Inputs Overview
Session Settings
Daily Session Open Hour (NY Time)
Line Settings
PDH Line Color
PDL Line Color
PD-EQ Line Color
Line Style (Solid / Dashed / Dotted)
Label Settings
Show/Hide Labels
Label Font Size
Label Text Colors
Label Offset (bars to the right)
🛡️ Non-Repainting
The indicator does not repaint.
Levels are locked in once the new session begins.

BTC Mon 8am Buy / Wed 2pm Sell (NY Time, Daily + Intraday)This strategy implements a fixed weekly time-based trading schedule for Bitcoin, using New York market hours as the reference clock. It is designed to test whether a consistent pattern exists between early-week accumulation and mid-week distribution in BTC price behavior.
Entry Rule — Monday 8:00 AM (NY Time)
The strategy enters a long position every Monday at exactly 08:00 AM Eastern Time, one hour after the U.S. equities market pre-open activity begins influencing global liquidity.
This timing attempts to capture early-week directional moves in Bitcoin, which sometimes occur as traditional markets come online.
Exit Rule — Wednesday 2:00 PM (NY Time)
The strategy closes the position every Wednesday at 2:00 PM Eastern Time, a point in the week where:
U.S. equity markets are still open
BTC often experiences mid-week volatility rotations
Liquidity is generally high
This exit removes exposure before later-week uncertainty and gives a consistent, measurable time window for each trade.
Timeframe Compatibility
Works on intraday charts (recommended 1h or lower) using precise time-based triggers.
Also runs on daily charts, where entries and exits occur on the Monday and Wednesday bars respectively (daily charts cannot show intraday timestamps).
All timestamps are synced to America/New_York regardless of the exchange’s native timezone.
Trading Frequency
Exactly one trade per week, preventing overtrading and allowing comparison of weekly performance across years of historical BTC price data.
Purpose of the Strategy
This is not a value-based or trend-following system, but a behavioral/time-cycle analysis tool.
It helps evaluate whether a repeating short-term edge exists based solely on:
Weekday timing
Liquidity cycles
Institutional market influence
BTC’s habitual early-week momentum patterns
It is ideal for:
Backtesting weekly BTC behavior
Studying time-based edges
Comparing alternative weekday/time combinations
Visualizing weekly P&L structure
Risk Notes
This strategy does not attempt to predict price direction and should not be assumed profitable without robust backtesting.
Time-based edges can appear, disappear, or invert depending on macro conditions.
There is no stop loss or risk management included by default, so the strategy reflects raw timing-based performance.
