Multi-Function Stochastic(MTF, divergence, signal and alert)Japanese below / 日本語説明は下記
Overview
Multi-function Stochastic indicator with functions below.
1.MTF with display timeframe control
2.Auto divergence drawing incl. hidden divergence
3.Signal when % K crosses over %D incl. MTF %K and %D
4.Alert when % K crosses over %D
Please see the details below.
Functions:
1.MTF with display timeframe control
You can select one upper timeframe from monthly, weekly, daily, 4hour, 1hour, 30mins, 15mins, 5mins to display upper timeframe’s Stochastic as MTF Stochastic.
How is it different from other MTF indicators?
Problems with other MTF Stochastic indicators are;
-If you set higher timeframe Stochastic, it will also be shown on further higher time frames.
i.e. If you set 4hour chart’s Stochastic on 1 hour or lower time frame charts, it will also appear on daily and weekly chart, which is not necessary.
To tackle these problems, this indicator has incorporated functions below.
-To show MTF Stochastic on timeframe lower than the upper timeframe you set as MTF timeframe.
For example, if you select daily timeframe for MTF Stochastic , the Stochastic will be shown only on 4 hour or lower timeframes(1H, 30M, 15M, 5M, 1M).
Left: 4hour chart, Middle: Daily chart, Right: Weekly chart
If you look at 4hour chart, daily chart’s Stochastic is shown(pale blue and orange) but weekly chart does not show daily chart’s Stochastic.
2.Auto divergence drawing incl. hidden divergence
Divergence line and hidden divergence line will be automatically drawn for the current timeframe Stochastic as per the logic below.
Bearish : When two consecutive pivot highs go up but %K values corresponding to each high go down.
Bullish: When two consecutive pivot lows go down but %K values corresponding to each low go up.
Pivot highs(lows) are identified when those are preceded by n lower highs(lows) and proceeded by n lower highs(lows).
* n is parameterized.
See the diagram below.
Bearish : When two consecutive pivot highs go down but %K values corresponding to each highs go up.
Bullish : When two consecutive pivot lows go up but %K values corresponding to each low go down.
3.Signal when % K crossing %D
Signal will be shown when;
-%K crosses over %D below lower band
-%K crosses under %D above upper band
-%K(MTF) crosses over %D(MTF) below lower band
-%K(MTF) crosses under %D(MTF) above upper band
4.Alert when % K crossing %D
Alert can be set when;
-%K crosses over %D below lower band
-%K crosses under %D above upper band
How to use this indicator?
This indicator is paid indicator and invited-only indicator.
Please contact me via private chat or follow links in my signature so that I can grant the access right to the indicator.
Comment section is only for comments on the indicator or updates. Please refrain from contacting me using comments to follow TradingView house rules.
———————————————————————————————————————
多機能ストキャスティクスインジケーターです。以下の機能が搭載されています。
1.マルチタイムフレーム機能(表示時間足制御機能付き)
2.ダイバージェンス自動描画機能(ヒドゥンダイバージェンス対応)
3.%Kが%Dをクロスした時にシグナル表示(MTFの%Kと%Dでも同様)
4.%Kが%Dをクロスした時にアラート設定可能
機能詳細は以下の通りです。
機能詳細
1.マルチタイムフレーム機能(表示時間軸制御機能付き)
月足、週足、日足、4時間足、1時間足、30分足、15分足、5分足の中から一つを選択し、上位足のストキャスティクスとして表示することができます。(不要な場合は非表示可能)
他のマルチタイムフレームストキャスティクスとの違い
他のマルチタイムフレームストキャスティクスのインジケーターでは、以下の問題に直面します。
・上位足のストキャスティクスを表示すると、さらに上位足でもそのストキャスティクスが表示され見にくくなる。
例: 4時間足のストキャスティクスを下位足で表示可能な様に設定すると、日足や週足でも表示され、チャートが見にくくなる。
この問題に対して、このインジケーターでは、
・上位足のストキャスティクスを表示する時間軸を制御することで上位足で不必要な情報を表示させない。
という機能を加えることでこの問題を解決しています。
具体的には、マルチタイムフレーム用に選択した上位足のタイムフレームより小さいタイムフレームでのみ上位足のストキャスティクスが表示されるようになっています。
例えば、上位足として日足を選択した場合、日足のストキャスティクスは4時間足、1時間足、30分足、15分足、5分足、1分足にのみ表示されます。
<サンプルチャート>
左から4時間足、日足、週足です。
4時間足では日足のストキャスティクスが表示されていますが、週足には表示されません。
2.ダイバージェンス自動描画機能(ヒドゥンダイバージェンス対応)
以下のロジックに基づきダイバージェンスを自動描画します。(不要な場合は非表示可能)
<通常のダイバージェンス>
下降示唆: 2つの連続する高値(*)が切り上げられているが、 それぞれの高値に対応するストキャスティクスの値は切り下げている場合
上昇示唆: 2つの連続する安値(*)が切り下がっているが、 それぞれの安値に対応するストキャスティクスの値は切り上がっている場合
*高値(安値)は、左右n本(**)ずつのローソク足の高値(安値)より高い(低い)高値(安値)をピボットハイ・ローとして算出しています。
** nはユーザ設定値です。
<例: ダイバージェンス>
高値SH1はSH1のローソクの高値より左側にn個のより低い高値、右側にn個のより低い高値があった場合に高値として認識されます。
上記の例では高値がSH1>SH2と切り上がっていますが、対応する%Kの値はvalue2>value1と切り下がっているためダイバージェンスと認識されダイバージェンスラインが自動描画されます。
<ヒドゥンダイバージェンス>
下降継続示唆: 2つの連続する高値(*)が切り下がっているが、 それぞれの高値に対応するストキャスティクスの値は切り上がっている場合
上昇継続示唆: 2つの連続する安値(*)が切り上がっているが、 それぞれの安値に対応するストキャスティクスの値は切り下がっている場合
言うまでもないことですが、ダイバージェンスが出たから逆張り、などの安易な発想は避けるべきです。
環境認識の一つの要素として見るべき指標でしょう。
3.%Kが%Dとクロスした時にシグナル表示(MTFの%Kと%Dでも同様)
以下の条件を満たした時にシグナルを表示します。
-ロワーバンドより下で、%Kが%Dを上抜けた時
-アッパーバンドより上で、%Kが%Dを下抜けた時
-ロワーバンドより下で、%K(MTF)が%D(MTF)を上抜けた時
-アッパーバンドより上で、%K(MTF)が%D(MTF)を下抜けた時
4.%Kが%Dとクロスした時にアラート設定
以下の条件でアラート設定が可能です。
-ロワーバンドより下で、%Kが%Dを上抜けた時
-アッパーバンドより上で、%Kが%Dを下抜けた時
インジケーターの使用について
当インジケーターは招待制インジケーター(有料)となっています。
使用を希望される方はプライベートチャットや下記リンクのDMでご連絡ください。
このページのコメント欄はインジケーターそのものに対するコメントやアップデートの記載のためのものとなっております。Tradingviewのハウスルールを守るためにもコメント欄からの連絡はご遠慮ください。
ダイバージェンス

VWAP Oscillator CandlesThe VWAP oscillator plots VWAP as the zero line with price, relative to VWAP. This can be use the same way you would traditionally use VWAP, with a much clearer picture of deviation from VWAP. Also, after creating the script, I noticed divergence was extremely noticeable here!

VWAP OscillatorI like a clean chart and trade primarily with price action alone, but the power of VWAP is undeniable, which is why VWAP is the basis of most of my scripts.
The VWAP oscillator plots VWAP as the zero line with exponential average price, relative to VWAP. This can be use the same way you would traditionally use VWAP, but after creating the script, I noticed divergence was also extremely noticeable here!

MOVE/VXTLT CorrelationMany know of the VIX for equity trading. Yet, many are unaware that there is the same kind of volatility measure for trading bonds, called the MOVE Index.
"The Merrill Lynch Option Volatility Estimate (MOVE) Index is a yield curve weighted index of the normalized implied volatility on 1-month Treasury options which are weighted on the 2, 5, 10, and 30 year contracts."
With this script one can see the the correlation and divergences between bonds and its volatility measure to make educated decisions in trading or hedging.
The idea of this script comes from NicTheMajestic.

TSI Strength Meter vs USD with divergenceThis indicator consists of two lines. One is a gray line (USD) and the asset indicator is green or red.
The basis of this indicator is the true strength indicator (TSI) with parameters 5,15. Both line sets are based on a TSI (5,15).
The lookback period is for new highs / new lows. Default value is 200 periods.
GREEN/RED LINE
The first that is green and red is whatever you choose to display ( BTC in this case).
The green and red lines indicate going up or going down.
GRAY LINE
The gray line is the US Dollar . So everything is relative to that by default.
ZERO LINE CROSSES
These are momentum shifts. If you see a crossover of both around the zero line, its a good indication there is a change in momentum and a reversal of trend.
NEW HIGHS NEW LOWS
There are 4 new colors added to this indicator. For the asset you are viewing, a lime color means new highs within the lookback period. A new low is indicated by a yellow line color.
The new lows for the USD are white for new lows within the lookback period and blue line for the new highs.
DIVERGENCE
You can also spot divergences easily. For example, if a lime color is seen on the indicator line, that means "new high" but if it occurs below the last "new high" it means the asset is going up to new highs but the indicator is showing us that the readings are below the previous new highs, indicating a negative divergence.
The same goes for the yellow colored lines. higher yellows mean positive divergence.
And with the US Dollar , blue lines dropping means a negative divergence in the US Dollar , while white lines moving up means a positive dollar divergence.
INTERPRETATION
Examples:
If you see a green and sometimes red line of the asset indicator and a gray line that drops below the zero line; it may mean the asset is rising and the trend is up.
If you see a green and red line below the zero line and with a gray line above the zero line , it indicates there is a negative trend. If you suddenly see blue lines on the USD, this means its hitting new lows. If these blue lines then start to slowly move downwards; then we have a positive divergence. If that were to be followed by the green line crossing the zero line, its a pretty good be that the trend is changing and its a very good buying oportunity.

MTF CCI with timeframe control function and signal/alertJapanese below. / 日本語説明は下記
Summary
This indicator shows CCI of the current timeframe and another CCI from upper timeframe as MTF CCI with ability to show signals and set alerts when crossing upper/bottom bands.
For general use of CCI, please refer to the link below(by TradingView)
jp.tradingview.com
How is it different from other MTF CCI indicators?
Problems with other MTF CCI indicators are;
-If you set higher timeframe CCI(MTF CCI), it will also be shown on further higher time frames.
i.e. If you set 4hour chart’s CCI on 1 hour or lower time frame charts, it will also appear on daily and weekly chart, which is not necessary.
To tackle these problems, this indicator has incorporated functions below.
-To be able to control timeframes where MTF CCI is displayed to eliminate unnecessary information when you open higher time frame’s charts.
For example, if you select daily timeframe for MTF CCI, the CCI will be shown only on 4 hour or lower timeframes.
These are the values added on this indicator.
Specifications
-This indicator shows one CCI from the current timeframe and another CCI from another timeframe(MTF).
-For MTF CCI, you can select upper timeframe from monthly, weekly, daily, 4hour, 1hour, 30mins, 15mins, 5mins.
Again, if you select weekly for MTF, for instance, then MTF CCI will be displayed on daily or lower timeframes. Other timeframes work same.
-For both CCI(current timeframe) and CCI(MTF), signals will be shown when they cross over/under upper band and lower band, which you can control display on style tab of the indicator.
-Alert can be set same as signal conditions.
Please see the sample chart below.
Brown triangle is signal for CCI(current timeframe) and maroon signal is for MTF CCI.
--------------------------------------------------------------------------------------------------
現在時間軸のCCIと上位足のCCIを表示するマルチタイムフレームCCI(MTF CCI)インジケーターです。アッパーバンド、ロワーバンドと交差した時にシグナルを表示するとともに、アラートの設定も可能です。
CCIの一般的な使い方は以下のリンク(TradingView)を参照ください。
jp.tradingview.com
他のマルチタイムフレームCCIとの違い
他のマルチタイムフレームCCIのインジケーターでは、以下の問題に直面します。
・上位足のCCIを表示すると、さらに上位足でもそのCCIが表示され見にくくなる。
例: 4時間足のCCIを下位足で表示可能な様に設定すると、日足や週足でも表示され、チャートがノイズだらけに・・・
この問題に対して、このインジケーターでは、
・上位足のCCIを表示する時間軸を制御することで上位足で不必要な情報を表示させない。
という機能を加えることでこれらの問題を解決しています。
機能概要
・このインジケーターでは現在の時間軸のCCIと上位足から一つのCCIを表示します。
・上位足は月足、週足、日足、4時間足、1時間足、30分足、15分足、5分足から選択することが可能です。
・上位足のCCIは選択した時間軸未満の時間軸に表示されます。
例:
日足のCCI : 4時間足、1時間足、30分足、15分足、5分足、1分足チャートにのみ表示
4時間足のCCI : 1時間足、30分足、15分足、5分足、1分足チャートにのみ表示
・上位足のCCIは選択した時間軸未満の時間軸に表示されます。
・現在時間軸のCCI、MTF CCIともに、アッパーバンド/ロワーバンドと交差したタイミングでシグナルを表示することができます。(アッパーバンド/ロワーバンドそれぞれに対して上に交差、下に交差のタイミングで表示されます。不要なものはスタイル設定画面で非表示とすることができます。)
・シグナルは設定画面で表示・非表示の切り替えができます。
・シグナルと同じ条件でアラート通知の設定が可能です。
サンプルチャート
1時間足に4時間足のCCIを表示したものです。茶色の三角が現在時間軸のCCIのシグナル。赤の三角がMTF CCIのシグナルです。

[FTA] Logarithmic MACD with Regular and Hidden DivergencesThis is a highly stable, volatility adaptive, Moving Average Convergence Divergence (MACD) that uses a modified calculation based on improved logarithmic measurements of the momentum.
1- This MACD provides the trader with most accurate detection of divergences, both regular and hidden ones, and shows them on the MACD Histogram.
2- Furthermore, the MACD/Signal divergences are also easily detectable (unlike the regular MACD which often does not provide accurate divergences; see the screenshot for comparison).
3- Finally, due to some different calculation methods, this MACD, unlike the regular MACD, is highly stable in higher time frames even in the most volatile markets (such as BTC, ETH, ADA, etc...) and thus can easily be utilized for the market prediction state in the crypto (see the screenshot for comparison).
Use it and let me know what you think about it in comparison to regular MACD!

MM Money Flow IndexThe Money Flow Index (MFI) is a momentum indicator that measures the flow of money into and out of a security over a specified period of time. It is related to the Relative Strength Index (RSI) but incorporates volume, whereas the RSI only considers price. The MFI is calculated by accumulating positive and negative Money Flow values (see Money Flow), then creating a Money Ratio. The Money Ratio is then normalized into the MFI oscillator form.
How this indicator works
Oversold levels typically occur below 20 and overbought levels typically occur above 80. These levels may change depending on market conditions. Level lines should cut across the highest peaks and the lowest troughs. Oversold/Overbought levels are generally not reason enough to buy/sell; and traders should consider additional technical analysis or research to confirm the security's turning point. Keep in mind, during strong trends, the MFI may remain overbought or oversold for extended periods.
If the underlying price makes a new high or low that isn't confirmed by the MFI, this divergence can signal a price reversal.
Calculation
The Money Flow Index requires a series of calculations.
First, the period's Typical Price is calculated.
Typical Price = (High + Low + Close)/3
Next, Money Flow (not the Money Flow Index) is calculated by multiplying the period's Typical Price by the volume.
Money Flow = Typical Price * Volume
If today's Typical Price is greater than yesterday's Typical Price, it is considered Positive Money Flow. If today's price is less, it is considered Negative Money Flow.
Positive Money Flow is the sum of the Positive Money over the specified number of periods.
Negative Money Flow is the sum of the Negative Money over the specified number of periods.
The Money Ratio is then calculated by dividing the Positive Money Flow by the Negative Money Flow.
Money Ratio = Positive Money Flow / Negative Money Flow
Finally, the Money Flow Index is calculated using the Money Ratio.

DBT MoMo Divergence FinderThis Indicator is an experimental Divergence Finder using the DBT MoMo formula. See DBT MoMo v.4 for details on the main script.
It uses a slower version of the DBT MoMo Price Line to smooth out the trend and color codes the Price Line based on its trend.
Bullish Divergence is denoted by Blue Labels below the Price Line.
Bearish Divergence is denoted by Orange Labels above the Price Line.
Alerts can be setup in Tradingview for both Bullish and Bearish Divergence Signals.
This indicator is brand new and experimental, make sure to double check the Divergence Alerts before blindly trading them. There can be a mathematical divergence without there being a visual divergence, this will trigger a false alert.
Everyone with access to the DBT MoMo will have access to this indicator as well.
On Chart Reverse RSI cyclic smoothed + DivergenceThis indicator is based on the amazing work of (@whentotrade) Lars von Theinen's RSI cyclic smoothed (cRSI). More information on the original indicator and how to use it can be found below.
The On Chart Reverse cRSI is a visual representational spin of the cRSI or (RSI cyclic smoothed, by Lars von Theinen) you all know and love with the addition of two key features, that in conjunction can be used to greatly assist the end-user in their decision making for entry, exit and risk management.
The first feature is the visual reverse engineered calculations of the HighBand, LowBand, as well as the user defined Upper and Lower Levels (70 & 30 by default), compared to the cRSI Level, in relation to the current price level as the point of divergence, which at a glance can then be used to visually see on the chart the closing price level needed in order to cross the cRSI either under or over the afore mentioned levels.
The second feature is the addition of my advanced On Chart divergence script in order to display regular as well as hidden divergences on the cRSI compared to the price level, in order to help the end-user train their eyes to spot them more accurately.
Divergence colors and description:
-------------------------------------
Green : Regular Bullish Divergence
White : Hidden Bullish Divergence
Red : Regular Bearish Divergence
Orange : Hidden Bearish Divergence
Optional Settings Include:
-----------------------------
1.) Show/Hide Reverse Levels
2.) Change the Reverse Levels Text Size
3.) Change the Reverse Levels Text Color
4.) Change the Reverse Levels Text Left Margin
5.) Change the Reverse Levels Decimal value
6.) Show/Hide the Reverse Levels Currency
7.) Show/hide the cRSI Divergence lines
8.) Change the cRSI Divergence line offset
9.) Show/hide the cRSI Divergence arrows
10.) Change the Regular Bullish Divergence Color
11.) Change the Hidden Bullish Divergence Color
12.) Change the Regular Bearish Divergence Color
13.) Change the Hidden Bearish Divergence Color
14.) Change the cRSI Divergence lookback (No. of bars to lookback)
RSI cyclic smoothed (cRSI)
-----------------------------
The RSI cyclic smoothed (cRSI) indicator is developed by Lars von Theinen and is subject to the terms of the Mozilla Public License 2.0 at mozilla.org Copyright (C) 2017 CC BY, whentotrade / Lars von Thienen. For more details on the cRSI Indicator:
RSI cyclic smoothed v2
The RSI cyclic smoothed (cRSI) is an enhancement of the classic RSI , adding
1) additional smoothing according to the market vibration,
2) adaptive upper and lower bands according to the cyclic memory and
3) using the current dominant cycle length as input for the indicator.
It is much more responsive to market moves than the basic RSI . The indicator uses the dominant cycle as input to optimize signal, smoothing, and cyclic memory. To get more in-depth information on the cyclic-smoothed RSI indicator, please read Decoding The Hidden Market Rhythm - Part 1: Dynamic Cycles (2017), Chapter 4: "Fine-tuning technical indicators." You need to derive the dominant cycle as input parameter for the cycle length as described in chapter 4.
Please PM me to obtain access.
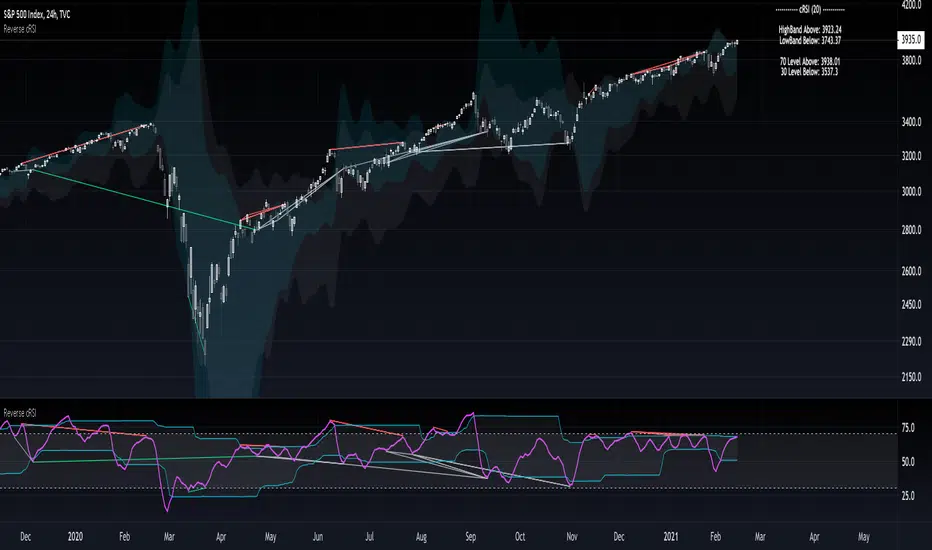
Reverse RSI cyclic smoothed + DivergenceThis indicator is based on the amazing work of (whentotrade) Lars von Theinen's RSI cyclic smoothed (cRSI). More information on the original indicator and how to use it can be found below.
The Reverse cRSI is in essence the same cRSI or (RSI cyclic smoothed, by Lars von Theinen) you all know and love with the addition of two key features, that in conjunction can be used to greatly assist the end-user in their decision making for entry, exit and risk management.
The first feature is a reverse engineered calculation of the HighBand, LowBand, as well as the user defined Upper and Lower Levels (70 & 30 by default), compared to the cRSI Level, in relation to the current price level as the point of divergence, which at a glance can then be used to determine the closing price level needed in order to cross the cRSI either under or over the afore mentioned levels.
The second feature is the addition of my advanced divergence script to display regular as well as hidden divergences on the cRSI, in order to help the end-user train their eyes to spot them more accurately.
Divergence colors and description:
-------------------------------------
Green : Regular Bullish Divergence
White : Hidden Bullish Divergence
Red : Regular Bearish Divergence
Orange : Hidden Bearish Divergence
Optional Settings Include:
-----------------------------
1.) Show/Hide Reverse Levels
2.) Change the Reverse Levels Text Size
3.) Change the Reverse Levels Text Color
4.) Change the Reverse Levels Text Left Margin
5.) Change the Reverse Levels Decimal value
6.) Show/Hide the Reverse Levels Currency
7.) Show/hide the cRSI Divergence lines
8.) Change the cRSI Divergence line offset
9.) Show/hide the cRSI Divergence arrows
10.) Change the cRSI Divergence arrow offset
11.) Change the Regular Bullish Divergence Color
12.) Change the Hidden Bullish Divergence Color
13.) Change the Regular Bearish Divergence Color
14.) Change the Hidden Bearish Divergence Color
15.) Change the cRSI Divergence lookback (No. of bars to lookback)
RSI cyclic smoothed (cRSI)
-----------------------------
The RSI cyclic smoothed (cRSI) indicator is developed by Lars von Theinen and is subject to the terms of the Mozilla Public License 2.0 at mozilla.org Copyright (C) 2017 CC BY, whentotrade / Lars von Thienen.
RSI cyclic smoothed v2
The RSI cyclic smoothed (cRSI) is an enhancement of the classic RSI , adding
1) additional smoothing according to the market vibration,
2) adaptive upper and lower bands according to the cyclic memory and
3) using the current dominant cycle length as input for the indicator.
It is much more responsive to market moves than the basic RSI . The indicator uses the dominant cycle as input to optimize signal, smoothing, and cyclic memory. To get more in-depth information on the cyclic-smoothed RSI indicator, please read Decoding The Hidden Market Rhythm - Part 1: Dynamic Cycles (2017), Chapter 4: "Fine-tuning technical indicators." You need to derive the dominant cycle as input parameter for the cycle length as described in chapter 4.

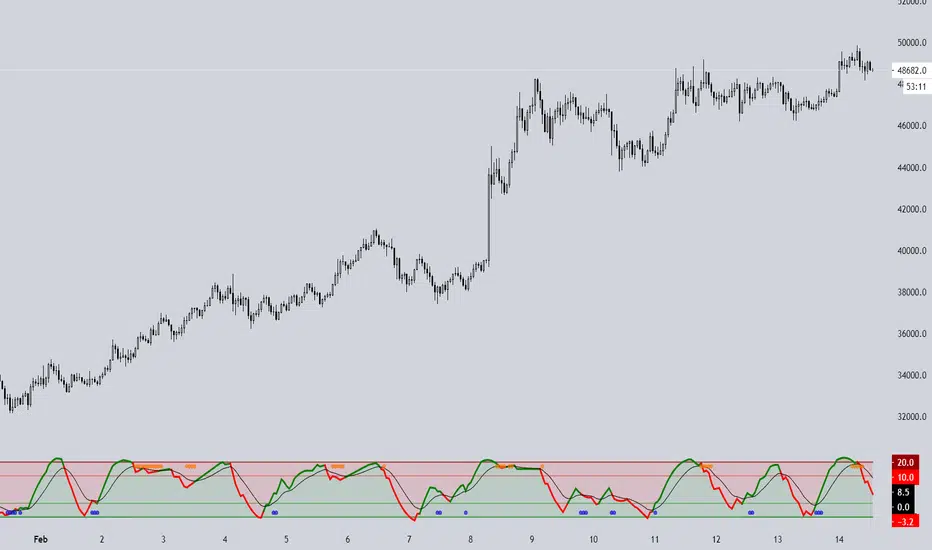
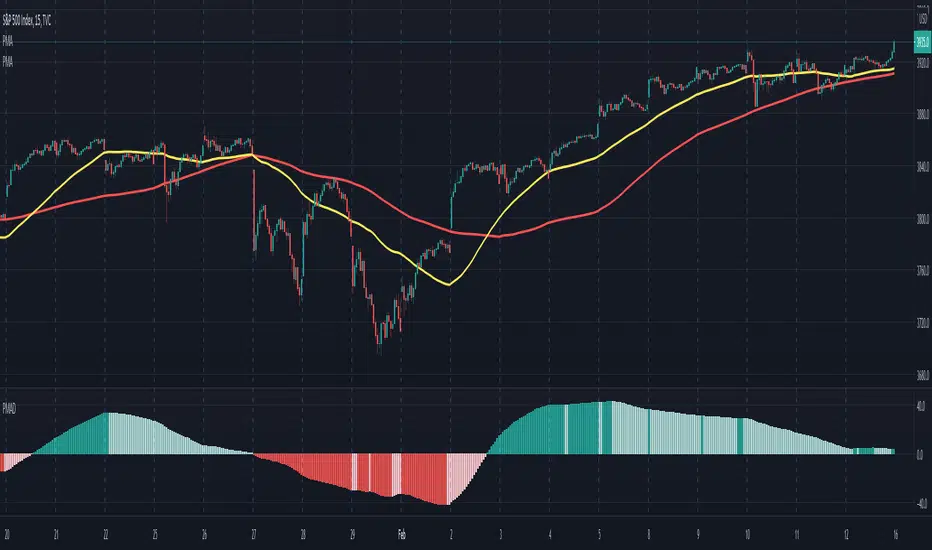
Moving Average Periodical DivergenceUses the difference between two PMA (Moving Average Periodical) indicators to create an oscillator.
Useful for visualizing daily/weekly cycles, strength and potential momentum. The defaults are 2 days (fast) and 5 days (slow).
MA Divergences StrategyThis is the Strategy version of the Study I published. It is a Moving Average that can be applied to any plot to plot divergences on any oscillator, as well as perform backtesting. You'll need a REALLY good oscillator to perform live trades using this alone, but I think it is a valuable tool and had the Strategy hanging around and for some reason didn't upload it yet.
So here it is.
Turn Length to 1 to follow the oscillator without lag. Turn Length up if you are getting too many false signals or tweak the original oscillator settings.
Uber Oscillator with DivergencesThis is a simple mod of the Uber Oscillator with more periods added to the mix and combined with a the Tradingview Divergence spotter.
Compare it to the standard Ultimate Oscillator and see the difference. Good to even overlay them even.
It basically just adds more detail. You won't always need it but sometimes it can catch big drops/peaks earlier then the standard AO while still retaining relative relaxedness during other periods.

MA Divergences for any indicatorThis is a mod of Tistas mod of the default RSI divergences.
www.tradingview.com
This is a SMA that can be applied to any indicator for divergence seeking. This can be useful if you use a custom indicator script and want divergences added, or for any oscillator really. Set the length to 1 and it will mirror the oscillator in question.

On Chart Reverse RSI+EMA Cross With DivergenceThe On Chart Reverse RSI+EMA Cross With Divergence is a visual representational spin of the original RSI+EMA to assist the end-user in their decision making for entry, exit and risk management, as well as freeing up space for the chart.
The On Chart Reverse RSI+EMA Cross With Divergence, which very basically is a smoothed reverse engineered calculation of the RSI's EMA Line gives the user a visual representation of the relationship between the current price and the RSI's EMA Line, which also includes RSI's divergences on the chart instead of having to reference the RSI itself. At a glance this can then be used to visually see on the chart potential momentum changes as well as the closing price level needed in order to cross the RSI either up or down.
Divergence colors and description:
------------------------------------------
Green : Regular Bullish Divergence
White : Hidden Bullish Divergence
Red : Regular Bearish Divergence
Orange : Hidden Bearish Divergence
Optional settings include:
-------------------------------
1.) Show/Hide the Reverse RSI+EMA Cross label
2.) Change the Reverse RSI+EMA Cross label text size
3.) Change the Reverse RSI+EMA Cross label text color
4.) Change the Reverse RSI+EMA Cross label left margin
5.) Show/hide the Reverse RSI+EMA Cross label currency
6.) Change the Reverse RSI+EMA Cross label decimal value
7.) Show/hide the RSI Divergence lines
8.) Change the RSI Divergence line offset
9.) Show/hide the RSI Divergence arrows
10.) Change the RSI Divergence arrow offset
11.) Change the RSI Divergence lookback (No. of bars to lookback)

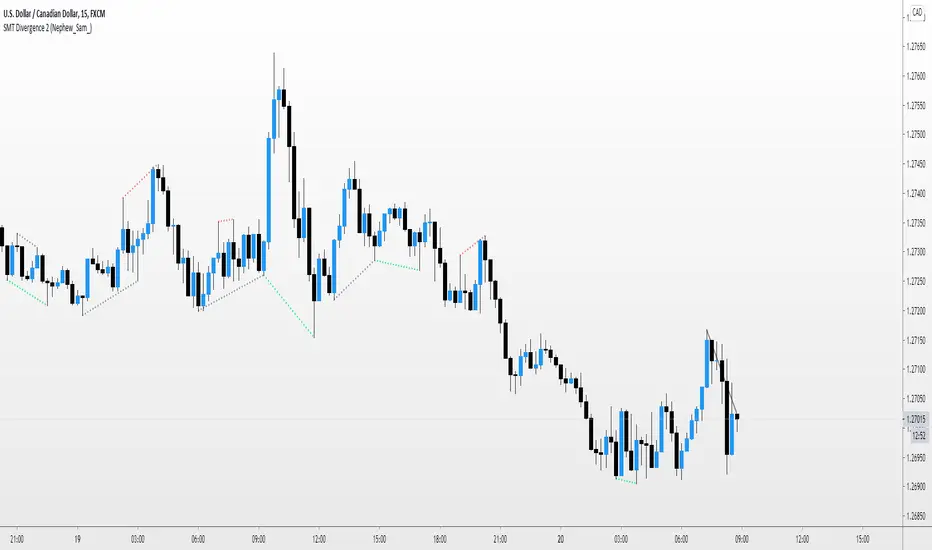
SMT Divergence 2 (Nephew_Sam_)(Top Chart Version)
Similar to the first version, this one plots divergence lines on the main chart instead of a separate panel.
Plots divergence between correlated pairs.
Ie. EURUSD - XAUUSD - DXY
NJDJPY - AUDJPY - NZD Index
XAU - XAG
USOIL - UKOIL
BTCUSD - ALTPERP
SMT Divergence (Nephew_Sam_)(Bottom Version)
Plots divergence between correlated pairs.
Ie. EURUSD - XAUUSD - DXY
NJDJPY - AUDJPY - NZD Index
XAU - XAG
USOIL - UKOIL
BTCUSD - ALTPERP

Reverse MACD Cross + Histogram DivergenceThe Reverse MACD Cross + Histogram Divergence is in essence the same MACD you all know and love with two added features which can be used to assist the end-user in their decision making for entry, exit and risk management.
The first feature is a Reverse MACD Cross price, which very basically is a smoothed reverse engineered calculation of the MACD Signal Line in relation to the current price level. At a glance this can then be used to determine the closing price level needed in order to cross the MACD either up or down.
The second feature is visual MACD Histogram regular as well as hidden divergences. This feature was added as MACD histogram divergences are not as easy to
spot as on the RSI for example, and can help the end-user train their eyes in order to spot them more accurately.
Divergence colors and description:
------------------------------------------
Green : Regular Bullish Divergence
White : Hidden Bullish Divergence
Red : Regular Bearish Divergence
Orange : Hidden Bearish Divergence
Optional settings include:
-------------------------------
1.) Show the Histogram only (Hide the MACD and Signal lines)
2.) Show/Hide the Reverse MACD Cross label
3.) Change the Reverse MACD Cross label text size
4.) Change the Reverse MACD Cross label left margin
5.) Show/hide the Reverse MACD Cross label currency
6.) Change the Reverse MACD Cross label decimal value
7.) Show/hide the MACD Histogram Divergence lines
8.) Change the MACD Histogram Divergence line offset
9.) Show/hide the MACD Histogram Divergence arrows
10.) Change the MACD Histogram Divergence arrow offset
11.) Change the MACD Histogram Divergence lookback (No. of bars to lookback)
Please PM me to obtain access.

Cyclic Smoothed RSI with Motive-Corrective Wave Indicator
This indicator uses the cyclic smoothed Relative Strength Index (cRSI) instead of the traditional Relative Strength Index (RSI). See below for more info on the benefits to the cRSI.
My key contributions
1) A Weighted Moving Average (WMA) to track the general trend of the cRSI signal. This is very helpful in determining when the equity switches from bullish to bearish, which can be used to determine buy/sell points. This is then is used to color the region between the upper and lower cRSI bands (green above, red below).
2) An attempt to detect the motive (impulse) and corrective and waves. Corrective waves are indicated A, B, C, D, E, F, G. F and G waves are not technically Elliot Waves, but the way I detect waves it is really hard to always get it right. Once and a while you could actually see G and F a second time. Motive waves are identified as s (strong) and w (weak). Strong waves have a peak above the cRSI upper band and weak waves have a peak below the upper band.
3) My own divergence indicator for bull, hidden bull, bear, and hidden bear. I was not able to replicate the TradingView style of drawing a line from peak to peak, but for this indicator I think in the end it makes the chart cleaner.
There is a latency issue with an indicator that is based on moving averages. That means they tend to trigger right after key events. Perfect timing is not possible strictly with these indicators, but they do work very well "on average." However, my implementation has minimal latency as peaks (tops/bottoms) only require one bar to detect.
As a bit of an Easter Egg, this code can be tweaked and run as a strategy to get buy/sell signals. I use this code for both my indicator and for trading strategy. Just copy and past it into a new strategy script and just change it from study to a strategy, something like this:
strategy("cRSI + Waves Strategy with VWMA overlay", overlay=overlay)
The buy/sell code is at the end and just needs to be uncommented. I make no promises or guarantees about how good it is as a strategy, but it gives you some code and ideas to work with.
Tuning
1) Volume Weighted Moving Average (VWMA): This is a “hidden strategy” feature implemented that will display the high-low bands of the VWMA on the price chart if run the code using “overlay = true”.
- If the equity does not have volume, then the VWMA will not show up. Uncheck this box and it will use the regular WMA (no volume).
- defines how far back the WMA averages price.
2) cRSI (Black line in the indicator)
- Increase to length that amount of time a band (upper/lower) stays high/low after a peak. Reduce the value to shorten the time. Just increment it up/down to see the effect.
- defines how far back the SMA averages the cRSI. This affects the purple line in the indicator.
- defines how many bars back the peak detector looks to determine if a peak has occurred. For example, a top is detected like this: current-bar down relative to the 1-bar-back, 1-bar-back up relative to 2-bars-back (look back = 1), c) 2-bars-back up relative to 3-bars-back (lookback = 2), and d) 3-bars-back up relative to 4-bars-back (lookback = 3). I hope that makes sense. There are only 2 options for this setting: 2 or 3 bars. 2 bars will be able to detect small peaks but create more “false” peaks that may not be meaningful. 3 bars will be more robust but can miss short duration peaks.
3) Waves
- The check boxes are self explanatory for which labels they turn on and off on the plot.
4) Divergence Indicators
- The check boxes are self explanatory for which labels they turn on and off on the plot.
Hints
- The most common parameter to change is the . Different stocks will have different levels of strength in their peaks. A setting of 2 may generate too many corrective waves.
- Different times scales will give you different wave counts. This is to be expected. A counter impulse wave inside a corrective wave may actually go above the cRSI WMA on a smaller time frame. You may need to increase it one or two levels to see large waves.
- Just because you see divergence (bear or hidden bear) does not mean a price is going to go down. Often price continues to rise through bears, so take note and that is normal. Bulls are usually pretty good indicators especially if you see them on C,E,G waves.
----------------------------------------------------------------------------------------------------------------------------
cyclic smoothed RSI (cRSI) indicator
----------------------------------------------------------------------------------------------------------------------------
The “core” code for the cyclic smoothed RSI (cRSI) indicator was written by Lars von Theinen and is subject to the terms of the Mozilla Public License 2.0 at mozilla.org Copyright (C) 2017 CC BY, whentotrade / Lars von Thienen. For more details on the cRSI Indicator:
The cyclic smoothed RSI indicator is an enhancement of the classic RSI, adding
1) additional smoothing according to the market vibration,
2) adaptive upper and lower bands according to the cyclic memory and
3) using the current dominant cycle length as input for the indicator.
It is much more responsive to market moves than the basic RSI. The indicator uses the dominant cycle as input to optimize signal, smoothing, and cyclic memory. To get more in-depth information on the cyclic-smoothed RSI indicator, please read Decoding The Hidden Market Rhythm - Part 1: Dynamic Cycles (2017), Chapter 4: "Fine-tuning technical indicators." You need to derive the dominant cycle as input parameter for the cycle length as described in chapter 4.
Hope this helps and good luck.

Divergence TemplateDivergence Template!
This public indicator helps you to find as many divergences with as many indicators you like, without the long hassle of knowing and coding the divergence yourself.
Just replace the "Divergence Condition" with your formula and give it a title in the second step, everything simply illustrated to someone without any coding experience!
This example is calculating A/D Divergences.
Let's make 2021 great!
With help of @madoqa.

Non-Rescaled RSI█ OVERVIEW
Relative Strength Index is a momentum oscillator developed by J. Wilder. The original version of RSI rescaled the relative strength measurement to range. While the rescaling is useful for readability, This non-rescaled version tells the exact average relative strength of the movement for the past period, and give another way to put the relative strength reading into context of current market condition.
█ Description & How To Use
1. The (+/-) in relative strength value indicates the direction
Example 1: Relative Strength of 2.33 means average gain is 2.33 bigger than average loss for the past period (Equivalent to RSI 70)
Example 2: Relative Strength of -2.33 means average loss is 2.33 bigger than average gain for the past period (Equivalent to RSI 30)
Example 3: Relative Strength of 0 means average gain is equal to average loss for the past period (Equivalent to RSI 50)
Look at comparison below:
2. You can use it exactly how you would use RSI: Overbought/Oversold state, Divergence, Trend identification, Failure Swings etc..
█ Features
- Overbought/Oversold line still maintainable as standard RSI level (70,30) in user input screen. The script will recalculate and plot the ob/os level accordingly
- Value Label to indicate the RSI and RS value
- Custom Gradient Color Scheme
█ Limitation
The Relative Strength absolute value is capped at 20 to avoid ratio value too big(or too small). This is enough to get accurate equivalent of RSI reading between 5-95
█ Disclaimer
Past performance is not an indicator of future results.
My opinions and research are my own and do not constitute financial advice in any way whatsoever.
Nothing published by me constitutes an investment/trading recommendation, nor should any data or Content published by me be relied upon for any investment/trading activities.
I strongly recommends that you perform your own independent research and/or speak with a qualified investment professional before making any financial decisions.

Divergence for Many Indicators v4Hello Traders,
Here is my new year gift for the community, Digergence for Many Indicators v4 . I tried to make it modular and readable as much as I can. Thanks to Pine Team for improving Pine Platform all the time!
How it works?
- On each candle it checks divergences between current and any of last 16 Pivot Points for the indicators.
- it search divergence on choisen indicators => RSI , MACD , MACD Histogram, Stochastic , CCI , Momentum, OBV, VWMACD, CMF and any External Indicator !
- it checks following divergences for 16 pivot points that is in last 100 bars for each Indicator.
--> Regular Positive Digergences
--> Regular Negative Digergences
--> Hidden Positive Digergences
--> Hidden Negative Digergences
- for positive divergences first it checks if closing price is higher than last closing price and indicator value is higher than perious value, then start searching divergence
- for negative divergences first it checks if closing price is lower than last closing price and indicator value is lower than perious value, then start searching divergence
Some Options:
Pivot Period: you set Pivot Period as you wish. you can see Pivot Points using "Show Pivot Points" option
Source for Pivot Points: you can use Close or High/Low as source
Divergence Type: you can choose Divergence type to be shown => "Regular", "Hidden", "Regular/Hidden"
Show Indicator Names: you have different options to show indicator names => "Full", "First Letter", "Don't Show"
Show Divergence Number: option to see number of indicators which has Divergence
Show Only Last Divergence : if you enable this option then it shows only last Positive and Negative Divergences
you can include any External Indicator to see if there is divergence
- enable "Check External Indicator"
- and then choose External indicator name in the list, "External Indicator"
- External indicator name is shown as Extrn
- related external indicator must be added before enabling this option
Coloring, line width and line style options for different type of divergences.
Following Alerts added:
- Positive Regular Divergence Detected
- Negative Regular Divergence Detected
- Positive Hidden Divergence Detected
- Negative Hidden Divergence Detected
Now lets see some examples:
Hidden Divergences:
Regular and Hidden Divergences together:
Showing first letters of indicators:
You can see only the number of indicators which has divergence:
You can see only divergence lines without indicators names and numbers:
option to used different label/line/text colors:
You have option to see only last divergences:
You can change Pivot Period, in following example Pivot Period = 15:
You can use Close or High/Low as Source for Divergence
You can include external indicators and get divergences on it:
Wish you all a happy new year!
Enjoy!
