Yearly CandlesPlots yearly candles from monthly candles data. This indicator could also be used to view yearly candles of those symbols for which candlesticks are not available in TradingView (for e.g., ECONOMICS:USINTR , ECONOMICS:USIRYY , ECONOMICS:USWG etc)
As these are not out of the box candles they do have these shortcomings -
Last candle's data is not available in status line, a separate label lists OHLC and change details near its close level
The very first candle's width may vary based on how much data is available for that year
Works only with monthly timeframe
Only those indicators that can be added on other indicators can be applied, however, they may still not work as intended as this still technically is a monthly chart!
Ohlc

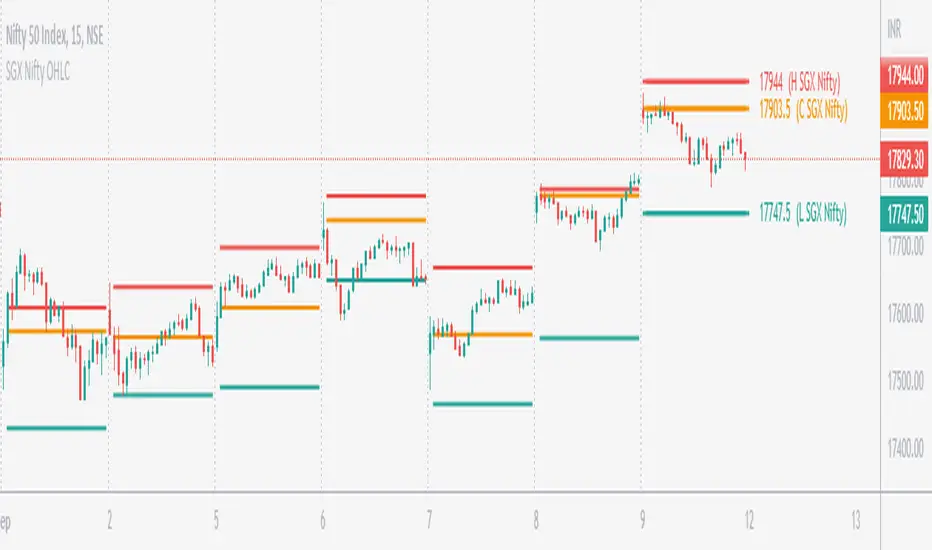
SGX Nifty OHLC for Nifty 50 IndexSGX Nifty OHLC for Nifty 50 Index
What is this Indicator?
• This indicator calculates the OHLC levels of SGX Nifty.
How does SGX Nifty impact NIFTY and the Indian Market?
• Helps in predicting NIFTY50 Index behavior.
• The closing price of today's 9.14 am (IST) SGX Nifty will be the Open of today's Nifty50 Open. This helps to determine the opening Gap of Nifty50.
• SGX Nifty OHLC levels can act as support and resistance in Nifty50.
Who to use?
• Beneficial for Day Traders, who trade in NIFTY Index.
What timeframe to use?
• Use 1 minute for better accuracy.
• Other timeframes will also work.
Important Note
• Use 1 min timeframe for accurate OHLC.
• In other timeframes OHLC will have negligible difference, it won't be huge.
• This indicator will appear only on NIFTY Index and Futures chart.
• To hide the warning label go to the indicator Menu.
OHLC Moving AverageThis indicator shows 4 moving averages of Open, High, Low and Close at the same time with an option to select SMA or EMA.
If you implement this indicator twice, you can make it look like the following chart.
One set of MA(red) is for current timeframe and another set(blue) is for higher timeframe, which is to identify potential support and resistance zones.
--------------------------
四本値(始値、高値、安値、終値)それぞれの移動平均線を同時に表示することのできるインジケーターです。
MAタイプはSMAかEMAを選択することができます。
このインジケーターを二つセットすると以下のように上位足の移動平均線とセットで表示することも可能です。
(赤がチャートの時間軸の4本値の移動平均線、青が上位足の4本値の移動平均線)
上位足の移動平均線をサポート・レジスタンスのゾーンとして捉える時などに活用できます。

OHLC MTFThe script allows you to plot the opening, highest, lowest and closing (ohlc) values of a previous candle.
Settings :
- "Time Frame" : allows you to choose the reference time frame;
- "Offset" : sets which candle to select the data from.
Ex : If you select "1 day" as the time frame and "1" as the offset, the OHLC values of yesterday's daily candle will be displayed (regardless of your current time frame).

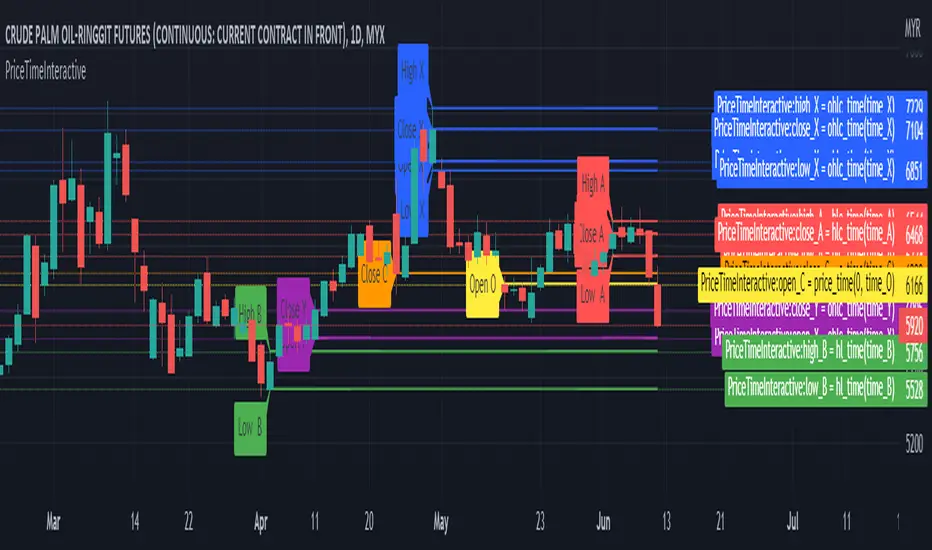
PriceTimeInteractive█ OVERVIEW
This library was intended to Get price of given time.input
█ CREDITS
Credits to TradingView for CAGR Custom Range.
█ FUNCTIONS
ohlc_time()
: Get OHLC price of given time.input
Parameters:
: : Time (t) must be using time.input
Returns: : OHLC
hlc_time()
: Get HLC price of given time.input
Parameters:
: : Time (t) must be using time.input
Returns: : HLC
hl_time()
: Get HL price of given time.input
Parameters:
: : Time (t) must be using time.input
Returns: : HL
Price Displacement - Candlestick (OHLC) CalculationsA Magical little helper friend for Candle Math.
When composing scripts, it is often necessary to manipulate the math around the OHLC. At times, you want a scalar (absolute) value others you want a vector (+/-). Sometimes you want the open - close and sometimes you want just the positive number of the body size. You might want it in ticks or you might want it in points or you might want in percentages. And every time you try to put it together you waste precious time and brain power trying to think about how to properly structure what you're looking for. Not to mention it's normally not that aesthetically pleasing to look at in the code.
So, this fixes all of that.
Using this library. A function like 'pd.pt(_exp)' can call any kind of candlestick math you need. The function returns the candlestick math you define using particular expressions.
Candle Math Functions Include:
Points:
pt(_exp) Absolute Point Displacement. Point quantity of given size parameters according to _exp.
vpt(_exp) Vector Point Displacement. Point quantity of given size parameters according to _exp.
Ticks:
tick(_exp) Absolute Tick Displacement. Tick quantity of given size parameters according to _exp.
vtick(_exp) Vector Tick Displacement. Tick quantity of given size parameters according to _exp.
Percentages:
pct(_exp, _prec) Absolute Percent Displacement. (w/rounding overload). Percent quantity of bar range of given size parameters according to _exp.
vpct(_exp, _prec) Vector Percent Displacement (w/rounding overload). Percent quantity of bar range of given size parameters according to _exp.
Expressions You Can Use with Formulas:
The expressions are simple (simple strings that is) and I did my best to make them sensible, generally using just the ohlc abreviations. I also included uw, lw, bd, and rg for when you're just trying to pull a candle component out. That way you don't have to think about which of the ohlc you're trying to get just use pd.tick("uw") and now the variable is assigned the length of the upper wick, absolute value, in ticks. If you wanted the vector in pts its pd.vpt("uw"). It also makes changing things easy too as I write it out.
Expression List:
Combinations
"oh" = open - high
"ol" = open - low
"oc" = open - close
"ho" = high - open
"hl" = high - low
"hc" = high - close
"lo" = low - open
"lh" = low - high
"lc" = low - close
"co" = close - open
"ch" = close - high
"cl" = close - low
Candle Components
"uw" = Upper Wick
"bd" = Body
"lw" = Lower Wick
"rg" = Range
Pct() Only
"scp" = Scalar Close Position
"sop" = Scalar Open Position
"vcp" = Vector Close Position
"vop" = Vector Open Position
The attributes are going to be available in the pop up dialogue when you mouse over the function, so you don't really have to remember them. I tried to make that look as efficient as possible. You'll notice it follows the OHLC pattern. Thus, "oh" precedes "ho" (heyo) because "O" would be first in the OHLC. Its a way to help find the expression you're looking for quickly. Like looking through an alphabetized list for traders.
There is a copy/paste console friendly helper list in the script itself.
Additional Notes on the Pct() Only functions:
This is the original reason I started writing this. These concepts place a rating/value on the bar based on candle attributes in one number. These formulas put a open or close value in a percentile of the bar relative to another aspect of the bar.
Scalar - Non-directional. Absolute Value.
Scalar Position: The position of the price attribute relative to the scale of the bar range (high - low)
Example: high = 100. low = 0. close = 25.
(A) Measure price distance C-L. How high above the low did the candle close (e.g. close - low = 25)
(B) Divide by bar range (high - low). 25 / (100 - 0) = .25
Explaination: The candle closed at the 25th percentile of the bar range given the bar range low = 0 and bar range high = 100.
Formula: scp = (close - low) / (high - low)
Vector = Directional.
Vector Position: The position of the price attribute relative to the scale of the bar midpoint (Vector Position at hl2 = 0)
Example: high = 100. low = 0. close = 25.
(A) Measure Price distance C-L: How high above the low did the candle close (e.g. close - low = 25)
(B) Measure Price distance H-C: How far below the high did the candle close (e.g. high - close = 75)
(C) Take Difference: A - B = C = -50
(D) Divide by bar range (high - low). -50 / (100 - 0) = -0.50
Explaination: Candle close at the midpoint between hl2 and the low.
Formula: vcp = { / (high - low) }
Thank you for checking this out. I hope no one else has already done this (because it took half the day) and I hope you find value in it. Be well. Trade well.
Library "PD"
Price Displacement
pt(_exp) Absolute Point Displacement. Point quantity of given size parameters according to _exp.
Parameters:
_exp : (string) Price Parameter
Returns: Point size of given expression as an absolute value.
vpt(_exp) Vector Point Displacement. Point quantity of given size parameters according to _exp.
Parameters:
_exp : (string) Price Parameter
Returns: Point size of given expression as a vector.
tick(_exp) Absolute Tick Displacement. Tick quantity of given size parameters according to _exp.
Parameters:
_exp : (string) Price Parameter
Returns: Tick size of given expression as an absolute value.
vtick(_exp) Vector Tick Displacement. Tick quantity of given size parameters according to _exp.
Parameters:
_exp : (string) Price Parameter
Returns: Tick size of given expression as a vector.
pct(_exp, _prec) Absolute Percent Displacement (w/rounding overload). Percent quantity of bar range of given size parameters according to _exp.
Parameters:
_exp : (string) Expression
_prec : (int) Overload - Place value precision definition
Returns: Percent size of given expression as decimal.
vpct(_exp, _prec) Vector Percent Displacement (w/rounding overload). Percent quantity of bar range of given size parameters according to _exp.
Parameters:
_exp : (string) Expression
_prec : (int) Overload - Place value precision definition
Returns: Percent size of given expression as decimal.

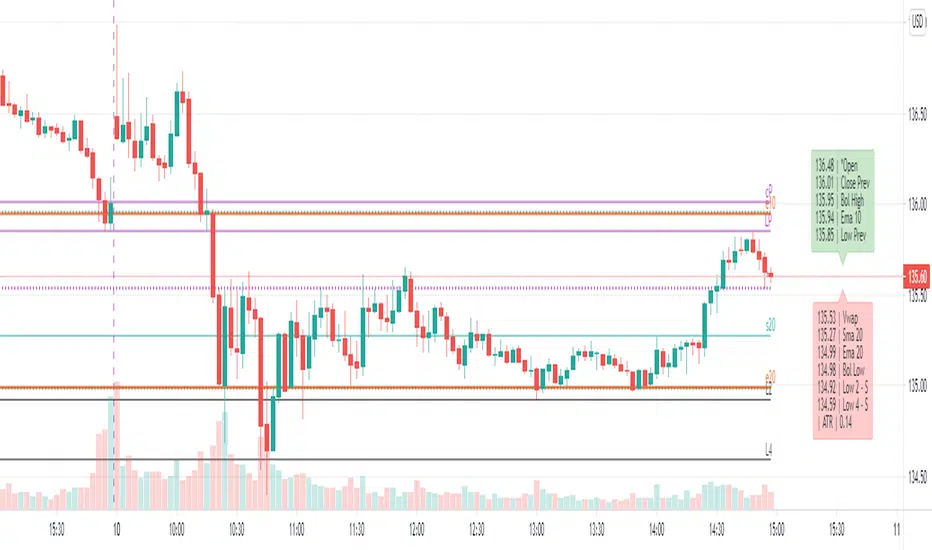
4C Daily Levels Suite + Premarket High/LowThis '4C Daily Levels Suite + Premarket High/Low' indicator is a clean way to automatically plot important daily levels including:
Prior Day High
Prior Day Low
Prior Day Close
50% level between Prior High/Low
Today's Open
Today's Premarket Low+High
This Daily Levels indicator is unique in its ability to:
-Plot all of the daily level PLUS premarket high/low levels (extended hours must be turned ON)
-Can hide past days levels, only plotting levels on the current day, to keep chart cleaner
-Can extend line levels right or fullscreen
-Plots the level price at each level on the chart
-Can show/hide price levels labels
-Can add supplemental premarket levels plot to show levels being formed during the premarket time period
-Coded with line.new vs plot so dashed lines are available as a style
-Automatically hides the indicator if the timeframe selected is Daily or greater
SEE SCREENSHOT EXAMPLES BELOW
Default mode, with extended hours showing:
With supplemental premarket plot showing:
Default mode without extended hours showing:
Showing past day’s levels
Extend lines to fullscreen
Some parts of this code were adapted from 'pd Levels' by CryptoCurl

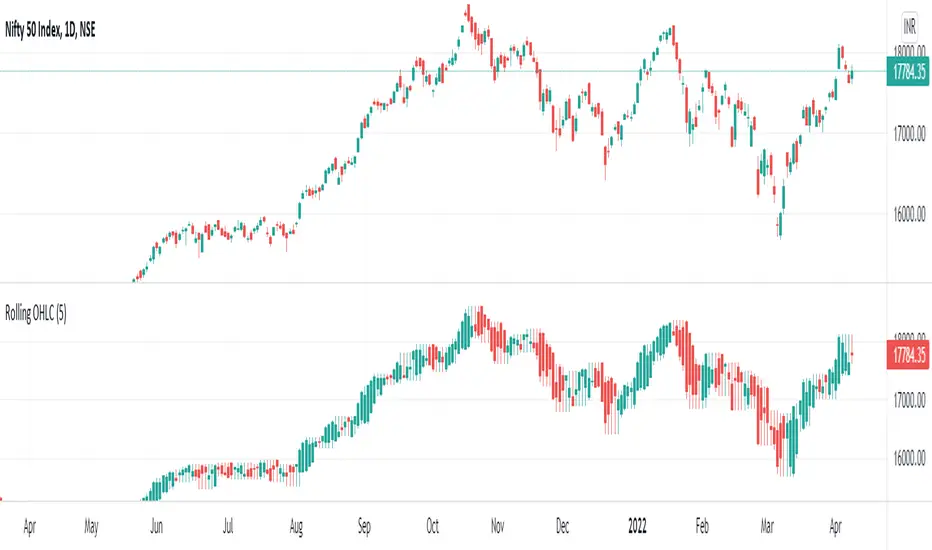
Rolling OHLC Candles█ OVERVIEW
This indicator displays a Rolling OHLC Bars for a given timeframe Multiplier. Contrary to OHLC Charts, if the timeframe Multiplier is "5", this indicator plot OHLC of the last 5 Candles.
█ WHAT IS THE NEED FOR IT
Let's see if we want to use a Higher timeframe OHLC Data using security function or resolution options. The indicator repaints until the higher timeframe OHLC Candle closes, leading to a repainting strategy or indicator using higher-timeframe data. So we can use Rolling OHLC Candles in these cases.
█ USES
To Pull out higher timeframe OHLC Data to build a non-repainting strategy or indicator.
Prominently, traders use Heikin Ashi Candles to locate trends or trading opportunities easier than traditional candlesticks. But the OHLC in those Heikin Ashi candles doesn't match with conventional candlesticks. We can use these Rolling OHLC Candles as an alternative for Heikin Ashi Candles because Here we can locate trends or trading opportunities easier than traditional candlesticks, and also close of these candles matches the close of the standard candlesticks, which can help us to take trades based on the close of the candles.
█ WHY I AM BUILDING THIS SIMPLE INDICATOR
There is no doubt higher timeframe analysis is a critical study to mastering the markets.
I found a necessity for an indicator that analyses multiple higher timeframes and gives us a cumulative or average trend direction. I already built the indicator; I will release it soon. The Indicator I am building is wholly based on my understanding and perspective of Market Structure. Please use this indicator idea to remove the repainting issue when you make an indicator that utilises higher timeframe data.
I am using this in my upcoming indicators. Felt to share before head.
Stay Tuned...
If you have any recommendations or alternative ideas, then please drop a comment under the script ;)
Lepelle's Key LevelsCredit to original code goes to paaax and NSDT. Modified to include premarket H/L levels and to show only daily levels. Indicator includes Close levels.
-US Premarket High and Low Levels
-Daily OHL Levels (No close included)
-Yesterday and Previous day OHLC level
-Labels and ability to modify user preferences (color, line)

Previous OHLC (Nephew_Sam_)This indicator plots the OHLC of a previous HTF candle with an option to show the HTF candle too on the lower timeframe.
(uses latest pine script version 5)
Options:
1. Custom timeframe (requires a higher timeframe from current chart period)
2. Show or hide OC and/or LH lines of previous candle
3. Show or hide the candle at the beginning of the new period
Styles
1. You can style all lines and candle colors from this tab.

MILK (My Intraday Lazy Kit)I made this script to group information considered useful in forex day trading, of course it can be used on crypto or other markets.
First of all, feel free to suggest any improvement/new feature you would consider interesting for such an use. This is not especially a final version and I'm sure other relevant information can be added in this tool.
Current features are the following
An international clock showing time and session status (open/closed) for 5 different cities. You can modify it in parameters.
Drawings of previous days/weeks open/high/low/close prices, which will be often used as supports and resistances zones.
The Clock shows
City
Time (with a bgcolor corresponding to the "period" of the day (Morning, Afternoon, Evening, Night)
Session status (Cyan when the corresponding session is open, blue when it's closed)
Price levels names are
YTD-H : Yesterday's high
YTD-L : Yesterday's low
YTD-C : Yesterday's close
YTD-O : Yesterday's open
PWH : Previous week high
PWL : Previous week low
PWO : Previous week open
PWC : Previous week close
Levels width and colors can be modified.
You can also enable/disable the clock, and daily or weekly levels in the options panel.
Nothing more to say for now, I mainly integrated information I like to have, but I'll probably add new features in it if I get some.

Dynamic Fibonacci Pivot Points & EMA CrossoversI have created this script for those who face difficulties drawing Fibonacci levels as this script is Dynamic so it automatically calculates the ranges based on current High and Lows. I have also added Standard Fibonacci Pivot Points so that we can easily see the confluences between Dynamic and Standard pivot points. Apart from this I have also added EMA Crossovers so that we can easily identify trend changes. You can modify this script as per your own.

OHLC - H.D.W.MThis indicatos plots Open and Close of the Curernt and Previous Day, Week or Month. It also shows the Highs and Lows of the Hourly, Daily, Weekly and Monthly Timeframes.

OHLC-Tables New FeatureHello All,
The command shows the opening-high-low-closing-change values of that day based on the previous value in each period.
You can set the clock in any time zone you want.
You can use the indicator by adapting it wherever you want on your screen. You can adjust its position. Top-Left-Middle Left- Bottom Left/ Top Right-Middle Right- Bottom Right.
Although it is not a command with a Buy-Sell indicator, its user-friendliness and convenience were taken into account while developing it.
The purpose of the indicator is to allow you to consider the values while focusing not only on the chart you are watching.

MTF CandleLevelsIn the spirit of freedom from oppression on this day of July 4th, 2021 in the United States, I hereby release this flagship indicator "MTF CandleLevels" into the wild for any subscribing TV member on the planet to utilize. It's now one my few great gifts to the souls of humankind within the realm of trading on TV. TradingView continues to bless Pine Script by releasing supplemental upgrades, enough for me to develop this indicator beyond it's experimental phase to full potential, as I had always wished to design it from theory. Educationally while using it, you will witness how OHLC/HA candles are actually formed for charts. I like to think of it as a candle formation microscope anyone can learn from.
It is intended for any style of trading or skill level from newcomer to advanced. There are no requirements/prerequisites for you use it. Which means you don't have to wear a mouth muzzle, get multiple doses of the life endangering FrankenJabs, subserviently bow down to authoritarian demands of obedience, or learn the ancient mystical art of deception "Fau Chi" in order to employ it's inherent power. A little sprinkle of satire helps with a dry technical read :). You have the absolute freedom to utilize it any way you see fit! That's right, it's even your choice whether you use it or not. The unshackled empowerment of choice always equates to FREEDOM. I can't program these precious gems without it...
One thing you will have noticed is it's specifically published on a Heikin Ashi(HA) chart, while having immunity to the Heikin Ashi candle charts unique open/close behavior. This has been believed to be an impossibility until now. For members who don't know, HA candle charts have a different `open` and `close` from the `open` and `close` of the other ordinary OHLC candle charts. Regardless of "CandleLevels Mode" chosen in Settings, the indicator will display identical on either bar chart type, excluding Renko, Line Break, Kagi, Point&Figure, and Range candle charts of course. It's abilities supersede the simpler "Multi-Time Period Charts" built-in TV indicator with a completely different architecture. For those of you extremely curious about how I accomplished this indicators level of code complexity, it was immensely difficult taking over a year of effort for this one functional unit, and I will leave it at that...
This novel MTF technology displays OHLC/HA support and resistance levels that mimic the functionality of larger duration candle formations in real time. Basically explained, while charting on a shorter duration timeframe candle chart, you can see open, high, low, and close levels fluctuate in the larger duration timeframe. This reduces the need to jump back and forth to view price action on different chart sampling intervals. You may even use multiple sets of CandleLevels indicators over a wide variety of chosen timeframe options, along with everything else in between.
The CandleLevels behavior is chosen within the indicator "Settings" using a selection mode of either the standard OHLC candlestick formations or Heikin Ashi candlestick formations. Each mode has a multitude of uses depending on the users trading style or timeframe.
Visbility of CandleLevels will ONLY occur when it is set to a larger duration timeframe interval than the current chart sampling rate. For example, you may be using the 5 minute interval sampling rate on the chart, yet you can easily see the open, high, low, close ranges with a chosen 120 minute timeframe setting. The multiple time frame(MTF) settings are highly adjustable having intervals of seconds, minutes, days, a multiple of the chart interval, or the common input(type=input.resolution) function provided by Pine.
CandleLevels come with multiple color schemes to reduce color interference with other indicators in the overlay pane, including the intended use of multiple sets of CandleLevels. My basic color scheme selections can be overridden to choose any imaginable color you desire for your visual acuity. Also, there are additional controls available to fine tune a visually pleasing appearance depending on your preferences and viewable area. One last new hidden fine tune capability, not only for this indicator but all TV indicators, is the agility to use up/down arrow keys on the keyboard when an indicator setting is in focus after mouse selection. For example, when choosing line thickness, you can modify values/options by key stroke. Try it out, I'm sure you will find this useful for any indictor for eternity.
NOTICE: There is only 500 line drawings available, in total to display, at this current release. This equates to 83 sets of CandleLevels maximum.
Features List Includes:
Candle type selection
MTF controls for seconds, minutes, days, multiple-of, and TV input
Multiple color schemes with color overrides
Color opacity selector
Line thickness control
Enable/disable capable MTF interval display with positioning
When available time provides itself, I will consider your inquiries, thoughts, and concepts presented below in the comments section, should you have any questions or comments regarding this indicator. When my indicators achieve more prevalent use by TV members, I may implement more ideas when they present themselves as worthy additions. Have a profitable future everyone!
RISK DISCLAIMER:
My scripts, indicators, and studies are specifically intended for informational and educational use only. These use historical data points to perform calculations to derive real-time calculations. They do not infer, indicate, or guarantee future results or performance.
By utilizing this script/indicator/study or any portion of it, you agree to accept 100% responsibly and liability for your investment or financial decisions, and I will not be held liable for your subjective analytic interpretations incurring sustained monetary losses. The opinions and information visual or otherwise provided by this script/indicator is not investment advice, nor does it constitute recommendation.

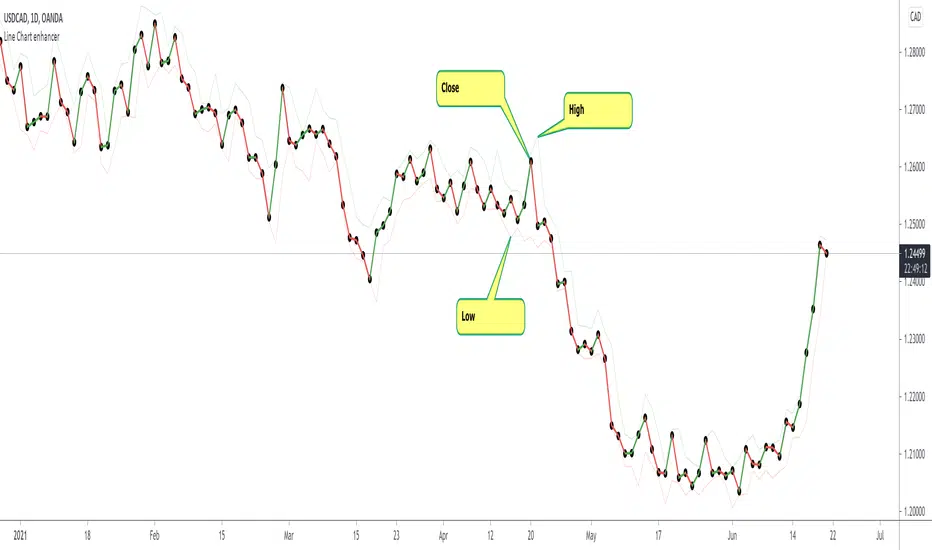
Line Chart Enhancer by makuchakuTradingview has a good line chart, but I wanted to make it even more awesome.
Some shortcomings which this line chart enhancer script fixes
Colors up move as green, down move as red (you can change them as you like)
Plots high and low - so that one can be aware about what the price is doing
To achieve the look with markers as shown above
Goto Symbol settings > Type > Select "With Markers"
Feedback welcome!
Weekly OHLC with Thursday closingWeekly timeframe on Tradingview show OHLC candles from Monday to Friday. NSE has index expiry dates on Thursday instead of Friday though. This script allows to plot OHLC candles with open on every Friday of the week and close on every Thursday of the week.

Example - HTF Step InterpolationAbout this script:
This example aims to highlight an alternative way to view HTF data by providing basic interpolation functionality.
This script does not aim to provide use in itself as an indicator or strategy.
Reason for study:
Educational Purposes Only

mOCP - volatility metricGauge price action (volatility) of current movements against sma of historical OHCP (open/close) percent_difference.

Dynamic levels from higher TF: EMA, SMA, OHLC, Bollinger, Vwap[ AR ] iLevels - indicator is intended for displaying important levels from a current and higher timeframe.
The indicator hides levels if they are far from the current price . The concealment range is based on the ATR * multiplier value. This keeps the graph clean and not shrinking .
Available levels:
- EMA - 5, 10, 20, 50, 100, 200, 300, 400, 500, 1000, 2000
- SMA - 20, 50, 100, 200
- Current day - Open/High/Low/Close
- Prev day - Open/High/Low/Close
- Prev days - Historical Open/High/Low/Close
- Vwap
- Local Bollinger - upper and lower channel boundaries from current timeframe
--- Detailed description ---
Why do you need an indicator?
The indicator is designed to display the most important levels from the current and upper time frames, which are support/resistance for the price. You do not need to constantly search for the level on the upper time frame and track it on the current one. For ease of understanding, here we will assume that the main time frame is one minute, and the upper one is daily, and we are trading intraday. Of course the indicator works on any time-frame. And the most convenient moment is that the indicator automatically hides and shows levels near the current price so that the chart does not shrink (does not increase along the vertical axis). An important point - the level is calculated for the current bar, i.e. 20 bars ago most likely it was not at this value (but you can see it through the market simulation). This means that the levels move with the price change and they are always horizontal for the current bar, and not historical in general.
Benefits
Automatic hiding of levels depending on ATR
Levels from the current time frame: Bollinger, Vwap
Levels from the upper time frame: Open/High/Low/Close of the current day and Open/High/Low/Close of the previous day
Levels from the upper time frame: popular EMAs, popular EMA fibonacci, popular SMA, previous historical High/Low, if the price did not touch them
Table (summary) with levels for quick orientation
When hovering over a table/level, a tooltip appears in%
Everything can customized. Levels, colors, styles, hints - you can customize everything and make a dream indicator.
Available levels
EMA and SMA
A whole set of popular EMAs from the higher time frame: 5, 10, 20, 50, 100, 200, 300, 400, 500, 1000, 2000. Fibonacci EMAs: 13, 34, 55, 89, 144, 233
In our basic example, we add the EMA from the daily chart to the minute chart:
SMA added only the most popular: 20, 50, 100, 200
Vwap and Bollinger Bands from the current time frame
Open/High/Low/Close of the current and previous day (bar)
Open/High/Low/Close of the current (example: Current Open) and the previous bar (example: Prev Open) are requested from the higher time frame. If we use the indicator on the data of the daily chart, then we get the open/close/min/max levels of the current and the previous day. These are the usual Pivot levels that can be used as support/resistance:
Historical Open/High/Low/Close
These are the Open/High/Low/Close values of 50+ previous bars from the upper time frame. Marked as o3 (the Open value of the 3rd bar back), H55 (the High value of the 55th bar back), etc. They serve as excellent support/resistance levels, you just need to look at the upper chart to determine the significance of this level
In our example with a one-minute chart and an upper daily time frame, we can, for example, see the exact values of the historical maximum resistance or some significant support at the close of the gap.
By default, only High and Low are enabled, as they are the most significant. The summary hint contains a letter after the level - R or S, respectively, this is resistance or support.
Another good example of historical levels. On the left chart there is a daily time frame, on the right is a minute with an indicator. The indicator accurately shows the nearest historical support Low 14, 19 and 54. On the left I have highlighted them for clarity:
Lines and labels
The line is the "level". The line is the ray. It starts from the last bar and goes to the left. Since this is a ray, looking at the historical data (rewinding the chart back), it will not rescale and collapse the chart.
Label is the abbreviated name of the level, for example V (Vwap), e50 (EMA 50), or H17 (High 17). The title has been abbreviated so as not to clutter up the graph. When you hover the mouse, a tooltip appears with the full name of the level, the price and the difference in % to this level from the current price.
Settings
The indicator is very flexible and you can customize it absolutely for any needs and tasks.
Higher time frame
This is the timeframe from where the indicator requests data for most levels.
You can use different variations: minute/day, day/week, etc.
Atr Multiplier
This is the setting that allows you to decrease/increase the number of displayed levels.
It's simple - a “space” is created near the price above and below. If the level falls into this “space”, then it is displayed.
The space above is calculated as:
Price + (ATR * AtrMultiplier) and below as: Price - (ATR * AtrMultiplier)
While on the minute chart, it is optimal to use the value up to 10, on the hourly chart - up to 2-3, on the daily chart - 0.5, etc.
Line Right Shift, Label Right Shift
How many bars the levels and labels above them move from the last bar. If Line Right Shift is set to negative, the line will start at this point and go to the right side of the chart.
Show Lines ?, Show Labels?
Need to show lines or labels above them? You can turn off one option and use only the other - lines without labels or vice versa.
Show Summary table?
Summary table is a table of data that conveniently displays the full name of the levels and the price. Hover displays a tooltip with levels as a percentage.
To maximize the acceleration of the trader, the following has been done:
Levels sorted by price
The table is split in two. Green table above - levels are more expensive than the current price (possible resistance). Red table below - levels are cheaper than the current price (possible support)
Distance between tables = ATR. We quickly and easily understand the value of ATR by looking at this distance. You can compare it with the nearest bars, which will give good information.
Show ATR in Summary?
In the lower table showing the value of the current ATR. Convenient, no additional indicator needed.
Always show in Summary
A list of levels that must always be displayed on the table, even if they are far away and have not appeared. The short names of the levels are specified, separated by commas. My basic set is Open, Vwap, EMA 10, EMA 20, Bollinger High, Bollinger Low.
Always show Levels
What levels should be displayed, even if they are far away. Bollinger channels are my choice. You can add Vwap, but in some cases it will compress the graph a lot, so Vwap is only in Summary by default.
Hide labels
In order not to clutter up the graph, you can remove some of the labels. For example, Bollinger Bands have their own style and are perceived visually - a mark above the level is not needed. You can add Vwap.
Replace labels on *
Which labels need to be replaced with an asterisk so as not to clog the graph. For example, this is Vwap, which has its own style. You can hover over the star and get a tooltip for the price.
Replace ALL labels on *
You can massively replace all tags with asterisks and get information when you hover over them.
Show Prevs Open/High/Low/Close?
4 settings that allow you to show historical levels. The labels are o12, H4, L72, c8. By default, only High and Low are enabled due to their significance.
Max Prev Days - how many bars back to get historical levels. Limited by TradingView's abilities and you can get about 50-100 bars back.
Current/Prev Open/High/Low/Close?
8 settings for displaying 8 levels of the current and previous day, which are important boundaries for the price. Current Close is disabled by default, as this is the current price level and is highlighted in TradingView.
Vwap?, Local Bollinger?, Sma ?, Ema?
Vwap level, Bollinger channels and a complete list of available Ema/Sma.
The most popular ones are enabled by default.
Color/Style/Width
Visual settings for lines. All lines are divided into 7 groups. Styles are customizable for the group as a whole.
Life hacks
You can add the indicator multiple times to the chart and set each copy to different time frames. For example, you have a minute chart. You add the indicator 3 times and set each indicator to daily, hourly and 15 minute time frames. Next, you set up the styles and colors for the lines on each indicator so that you can easily distinguish them from each other. Thus, you will not miss a single important level when trading intraday.
Known Issues
The main problem is overlapping of labels and levels. Overlapping labels is difficult to solve, but work is underway.
A side issue is the visual styles of levels and labels. The main goal is to create well-visually perceptible lines so that they can be instantly identified without reading the mark. We need to create a good color scheme for the level groups.
How can the community help and improve the indicator?
Suggest ideas.
Please, write them in the comments. Suggest edits to existing functionality. Suggest solutions to problems, new features, etc.
I believe that the community's suggestions for improvement can bring the indicator to perfection.
Thanks you!
NSDT Daily Key LevelsSimple script to show key levels of current day and previous day. Labels can be turned on and off as needed. Line colors, thickness and style can be changed. Modified the "M/W/D Level" script from paaax. Credit for original code goes to him. Link to script and profile posted in code of this script.

Yesterday's RTH&ON sessions OHLCsThe indicator plots the OHLC levels of both trading sessions of the day before: the overnight session and the Regular Trading Hours.

Previous OHLCThe scripts places horizontal levels on your charts indicating the previous Daily, Weekly or Monthly OHLC values over the current timeframe.
Slightly modified version of Nanda86's "Previous OHLC" script. I corrected a couple of bugs and added more control over colors and labels in general. I also removed the hourly OHLCs.
