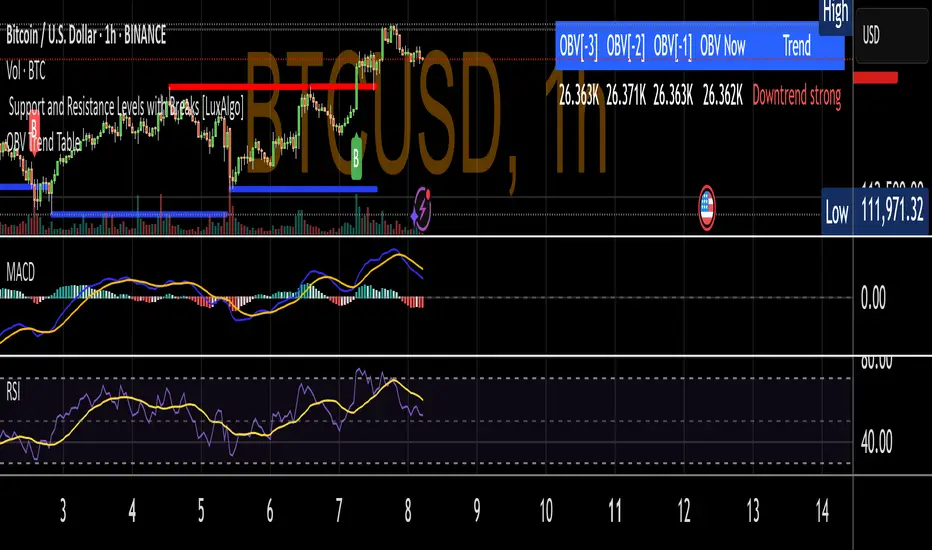
OBV Trend TableDisplays last 3 TF OBV values and current value of OBV. Also displays one of the trend values
- Uptrend healthy (price ↑ + OBV ↑)
- Downtrend strong (price ↓ + OBV ↓)
- Early reversal (price and OBV diverge)
- No clear trend (flat or mixed)
Relativevolume
Volume Statistics - IntraweekVolume Statistics - Intraweek: For Orderflow Traders
This tool is designed for traders using volume footprint charts and orderflow methods.
Why it matters:
In orderflow trading, you care about the quality of volume behind each move. You’re not just watching price; you’re watching how much aggression is behind that price move. That’s where this indicator helps.
What to look at:
* Current Volume shows you how much volume is trading right now.
* Central Volume (median or average over 24h or 7D) gives you a baseline for what's normal volume VS abnormal volume.
* The Diff vs Central tells you immediately if current volume is above or below normal.
How this helps:
* If volume is above normal, it suggested elevated levels of buyer or seller aggression. Look for strong follow-through or continuation.
* If volume is below normal, it may signal low interest, passive participation, a lack of conviction, or a fake move.
* Use this context to decide if what you're seeing in the footprint (imbalances, absorption, traps) is actually worth acting on.
Extra context:
* The highest and lowest volume levels and their timestamps help you spot prior key reactions.
* Second and third highest bars help you see other major effort points in the recent window.
Comment with any suggestions on how to improve this indicator.

Previous VWAP Levels by Riotwolftrading The "Previous VWAP" indicator calculates and displays the previous session's Volume Weighted Average Price (VWAP) for five timeframes (Daily, Weekly, Monthly, Quarterly, Yearly).
Each VWAP is plotted as a horizontal line extending to the right edge of the chart, with customizable labels at the right to identify each level. The indicator is designed for traders who want to visualize key price levels from prior periods without cluttering the chart with current VWAPs or additional metrics like standard deviations.
**Functionality**:
- **Calculates Previous VWAPs**: Computes the VWAP for the previous session of each timeframe (Daily, Weekly, Monthly, Quarterly, Yearly) based on the input source (default: `hlc3`) and volume.
- **Visual Style** : Uses `line.new` to draw horizontal lines from five bars back to the current bar, ensuring the lines extend to the right edge of the chart. Labels are placed at the right edge using `label.new` for clear identification.
- **Customization** : Allows users to toggle visibility, adjust line styles, widths, colors, and label sizes, and choose between abbreviated or full label text.
- **Minimalist Design**: Focuses solely on previous VWAPs, omitting current VWAPs, rolling VWAPs, and standard deviation bands to keep the chart clean.
**Intended Use**: This indicator is useful for traders who rely on historical VWAP levels as support/resistance or reference points for trading decisions, particularly in strategies involving mean reversion or breakout trading.
---
### Rules and Features
*VWAP Calculation**:
- The VWAP is calculated as the cumulative sum of price (`src`) multiplied by volume (`sumSrcVol`) divided by the cumulative volume (`sumVol`) for each timeframe.
- The "previous VWAP" is the VWAP value from the prior session, captured when a new session begins (e.g., new day, week, month, etc.).
- The indicator uses the `hlc3` (average of high, low, close) as the default source, but users can modify this in the settings.
**Timeframes**:
- **Daily**: Previous day's VWAP.
- **Weekly**: Previous week's VWAP.
- **Monthly**: Previous month's VWAP.
- **Quarterly**: Previous quarter's VWAP (3 months).
- **Yearly**: Previous year's VWAP (12 months).
- New sessions are detected using `ta.change(time(period))` for each timeframe.
**Line Drawing**:
- Lines are drawn using `line.new` from `time ` (five bars back) to the current bar (`time`), ensuring they extend to the right edge of the chart.
- Lines are updated only on the last confirmed bar (`barstate.islast`) to optimize performance and avoid repainting.
- Previous lines are deleted (`line.delete`) to prevent overlapping or clutter.
**Labels**:
- Labels are drawn at the right edge (`x=time`, `xloc=xloc.bar_time`) with `label.new`.
- Users can choose between abbreviated labels (e.g., "pvD" for Previous Daily VWAP) or full labels (e.g., "Prev Daily VWAP").
- Label sizes are customizable (`tiny`, `small`, `normal`, `large`, `huge`).
- Labels are deleted (`label.delete`) on each update to maintain a clean chart.
5. **Customization Options**:
- **Visibility**: Toggle each VWAP (Daily, Weekly, Monthly, Quarterly, Yearly) on or off.
- **Colors**: Individual color settings for each VWAP line and label (default colors: Daily=#E12D7B, Weekly=#F67B52, Monthly=#EDCD3B, Quarterly=#3BBC54, Yearly=#2665BD).
- **Line Style**: Choose from `solid`, `dotted`, or `dashed` lines.
- **Line Width**: Adjustable from 1 to 4 pixels.
- **Label Settings**: Enable/disable labels, abbreviate text, and select label size.
- **Source**: Customize the price source (default: `hlc3`).
**Performance Optimization**:
- The indicator only updates lines and labels on the last confirmed bar to minimize computational overhead.
- Uses `var` to initialize variables and avoid unnecessary recalculations.
- Deletes previous lines and labels to prevent chart clutter.
---
### Usage Instructions
1. **Add to Chart**:
- In TradingView, go to the Pine Editor, paste the script, and click "Add to Chart."
- The indicator will overlay on the price chart, showing previous VWAP lines and labels.
2. **Configure Settings**:
- Open the indicator settings to customize:
- Toggle visibility of each VWAP timeframe.
- Adjust colors, line style, and width.
- Enable/disable labels, choose abbreviation, and set label size.
- Modify the source if needed (e.g., use `close` instead of `hlc3`).
3. **Interpretation**:
- **Previous VWAPs**: Act as dynamic support/resistance levels based on the prior session's volume-weighted price.
- **Timeframes**: Use shorter timeframes (Daily, Weekly) for intraday/swing trading, and longer timeframes (Monthly, Quarterly, Yearly) for positional trading.
- **Labels**: Identify each VWAP level at the right edge of the chart for quick reference.
4. **Best Practices**:
- Use on charts with sufficient volume data, as VWAP relies on volume (a warning is triggered if no volume data is available).
- Combine with other indicators (e.g., moving averages, RSI) for confirmation in trading strategies.
- Adjust line styles and colors to avoid visual overlap with other chart elements.
---
### Example Use Case
A trader using a 1-hour chart can add the "Previous VWAP" indicator to identify key levels from the prior day, week, or month. For example:
- The Previous Daily VWAP might act as a support level for a bullish trend.
- The Previous Weekly VWAP could serve as a target for a swing trade.
- Labels at the right edge make it easy to identify these levels without cluttering the chart.
This indicator provides a clean, customizable way to visualize previous VWAPs, making it ideal for traders who want historical price context with minimal chart noise. For the complete Pine Script code, refer to the artifact provided in the previous response.

JHW Volume Based Buy and Sell MomentumThe JHW Volume-Based Buy and Sell Momentum indicator is a custom momentum oscillator designed to capture market sentiment based on volume dynamics and price rate of change (ROC). It aims to identify bullish or bearish momentum by analyzing how price reacts to increasing or decreasing trading volume.
Core Logic:
The indicator calculates the Rate of Change (ROC) of the closing price.
It then accumulates this ROC separately based on whether the current volume is lower or higher than the previous bar:
If volume decreases, the ROC is added to a "negative volume index" accumulator.
If volume increases, the ROC is added to a "positive volume index" accumulator.
These two accumulators are combined to form a net momentum line.
Smoothing:
A Simple Moving Average (SMA) is applied to both accumulators over a user-defined period (default: 25 bars).
The sum of these smoothed values forms the signal line.
Visualization:
The indicator plots:
The net momentum line (yellow).
The smoothed signal line (blue).
The area between the two lines is filled with color:
Yellow when momentum is above the signal (bullish).
Blue when momentum is below the signal (bearish).
Bar colors are also adjusted to reflect the current momentum state.
Use Case:
This indicator helps traders:
Detect volume-driven momentum shifts.
Identify potential buy or sell zones based on volume behavior.
Confirm trends or spot early reversals.

Volume-Based Candle ShadingThe Volume Shading indicator dynamically adjusts the color brightness of each price bar based on relative volume levels. It helps traders quickly identify whether a candle formed on low, average, or high volume without needing to reference a separate volume pane.
Candles are shaded dynamically as they form, so you can watch volume flow into them in real time. This indicator is designed to be as minimally intrusive as possible, allowing you to visualize volume levels without extra clutter on your charts.
The additional volume indicator in the preview above is there just for a point of reference to allow you to see how the shading on the bars correlates to the volume.
⸻
SETTINGS:
Bullish and bearish base colors — These serve as the midpoint (average volume) for shading.
Brightness mapping direction — Optionally invert the shading so that either high volume appears darker or lighter.
Volume smoothing length — Defines how many bars are averaged to determine what constitutes “normal” volume.
Candles with volume above average will appear darker or lighter depending on user preference, while those with average volume will be painted the chosen colors, giving an intuitive gradient that enhances volume awareness directly on the chart.
⸻
USES:
Confirming price action: Highlight when breakout candles or reversal bars occur with high relative volume, strengthening signal conviction.
Spotting low-volume moves: Identify candles that lack volume support, potentially signaling weak continuation or false breakouts.
Enhancing visual analysis: Overlay volume dynamics directly onto price bars, reducing screen clutter and aiding faster decision-making.
Custom visual workflows: Adapt the visual behavior of candles to your trading style by choosing color direction and base tones.

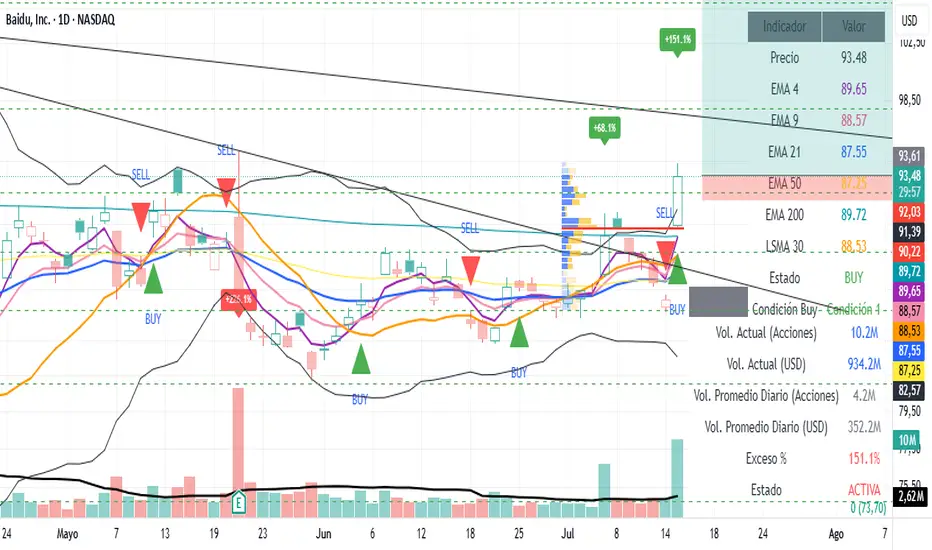
Volume Spike AlertIndicator Features:
📊 Core Functionalities:
Exceptional Volume Detection:
Calculates volume in USD (volume × price)
Compares it against a 90-day average (3 months)
Configurable from 1 to 252 days
Visual Signals:
Green labels for bullish candles with high volume
Red labels for bearish candles with high volume
Displays excess percentage (e.g., +45.2%)
Dual Alert System:
AlertCondition: For manual alert configuration in TradingView
Alert(): Automated alerts with detailed information
⚙️ Available Settings:
Average Period: 1–252 days (default: 90 days)
Enable/Disable Alerts: Configurable checkbox
Show/Hide Labels: Visual control
Label Size: Tiny, Small, Normal, Large
Minimum Threshold: Minimum percentage required to trigger a signal
📋 Displayed Information:
On Labels:
Excess percentage (e.g., +67.3%)
Color based on candle direction
In the Table:
Current volume in millions USD
Average volume in millions USD
Excess percentage
Alert status (ACTIVE/NORMAL)
Calculation period
In Alerts:
Candle type (BULLISH 🟢 / BEARISH 🔴)
Symbol and current price
Current volume vs. average
Timeframe used
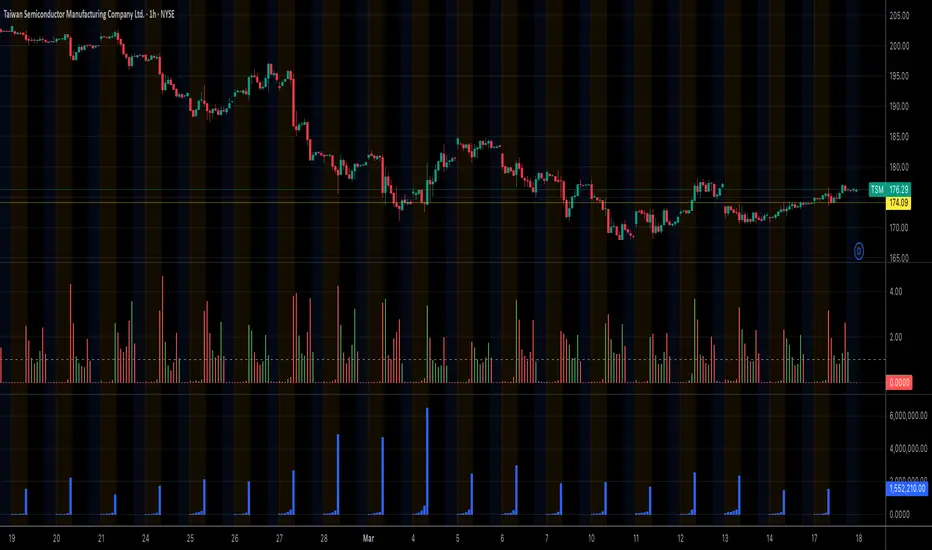
Volume Spike Analyzer(SMA10-Based)📊 **Volume Spike Analyzer (SMA10-Based)**
This indicator highlights abnormal volume activity by comparing current volume to the 10-period Simple Moving Average (SMA) of volume. It helps traders visually identify unusual activity that may precede breakouts, reversals, or news-driven moves.
---
🔧 **Features:**
• ✅ Colors volume bars:
• Green = Volume > SMA(10)
• Red = Volume ≤ SMA(10)
• ✅ Detects and labels spike levels:
• 🔶2x — Volume > 2x SMA(10)
• 🟢3x — Volume > 3x SMA(10)
• 🔴4x — Volume > 4x SMA(10)
• ✅ Built-in alerts for all 3 spike levels
---
📈 **Best Use Cases:**
• Confirm breakouts with strong volume
• Detect accumulation/distribution
• Filter low-volume setups
• Combine with VWAP/EMA for directional confirmation
---
⏱️ **Recommended Timeframes:**
• Intraday: 5m, 15m, 1h
• Also works on daily for swing trades
---
🧠 **Pro Tips:**
• Use with VWAP or EMA(20/50/200) for confluence
• Add SMA(Volume, 10) to your price chart for quick correlation
• Combine with candle pattern detection for signal validation
---

Time-Specific Volume AverageA volume indicator based on historic volume.
Checks for the average volume in the past few days at the same time of day. This helps you determine when there is truly volume in the markets.
We will see often see sustained volume above the average during a clear trend. If you see spikes in volume without it being sustained above the average, it is very likely that the trend will die off quickly.
This is very helpful in determining whether to trade based on a trend following system, or a range based system.
Settings are below:
Days to average: Number of days to look back(tradingview has limits depending on your plan)
SMA Length: Number of "volume averages" to look at. Keep this at 1 if you want the average volume at the exact moment in the day. If you increase it, will also average in the past few candles of "volume averages".
SMA Multiplier: Multiplies the SMA by this amount(helps to get higher quality trends)

Relative Volume Indicator (RVOL)Relative Volume Indicator (RVOL) is a powerful tool designed for intraday traders who want to quickly identify key areas of interest based on relative volume activity.
This indicator compares the current candle’s volume with the historical average volume over a customizable lookback period (default is 20). It highlights when volume is:
🔴 Below average
🟡 Average
🟢 Above average
🟣 Extremely high
⚙️ Customizable Settings:
Lookback period for average volume
Volume thresholds (average, above average, extreme)
Custom colors for each volume zone
🎯 Best suited for:
Scalping strategies
Breakout confirmation
Volume-based entries at key support/resistance levels
Spotting unusual or algorithmic trading activity
📈 Works across all timeframes.
🎨 Fully customizable from the settings panel.
🔔 Alerts coming in future versions.

VWAP Adaptive (RelVol-Adjusted)This indicator provides an Adaptive VWAP that adjusts volume weighting using RelVol (Relative Volume at Time), offering a more accurate and context-aware price reference during sessions with irregular volume behavior.
Classic VWAP calculates the average price weighted by raw volume, without considering the time of day. This becomes a serious limitation during major market events such as CPI releases, FOMC announcements, NFP, or large-cap earnings. These events often trigger massive volume spikes within one or two candles. As a result, the classic VWAP gets pulled toward those extreme prices and becomes permanently skewed for the rest of the session.
In such conditions, classic VWAP becomes unreliable. It no longer reflects fair value and often misleads traders relying on it for dynamic support, resistance, or reversion signals.
This Adaptive VWAP improves on that by using RelVol, which compares the current volume to the average volume seen at the same time over previous sessions. It gives more weight to price when volume is typical for that moment, and adjusts the influence when volume is statistically abnormal. This reduces the impact of isolated volume spikes and stabilizes the VWAP path, even in high-volatility environments.
For example, on SPY 1-minute or 5-minute charts during a CPI release, a massive spike in volume and price can occur within a single candle. Classic VWAP will immediately anchor itself to that spike. Adaptive VWAP using RelVol softens that effect and maintains a more realistic trajectory.
Key features:
- Adaptive VWAP weighted by time-adjusted Relative Volume (RelVol)
- Designed to maintain VWAP reliability during macroeconomic events
- Flexible anchoring: Session, Week, Month, Quarter, Earnings, etc.
- Optional display of Classic VWAP for comparison
- Up to 3 customizable deviation bands (standard deviation or percentage)
This tool is ideal for intraday traders who need a VWAP that remains usable and unbiased, even in volatile sessions. It adds robustness to VWAP-based strategies by incorporating time-sensitive volume normalization.

VOL & AVG OverlayCustom Session Volume Versus Average Volume
Description:
This indicator will create an overlay on your chart that will show you the following information:
Custom Session Volume
Average For Selected Session
Percentage Comparison
Options:
Set Custom Time Frame For Calculations
Set Custom Time Frame For Average Comparison
Set Custom Time Zone
Enable / Disable Each Value
Change Text Color
Change Background Color
Change Table location
Example:
Set indicator to 30 period average. Set custom time frame to 9:30am to 10:30am Eastern/New York.
When the time frame for the calculation is closed , the indicator will provide a comparison of the current days volume compared to the average of 30 previous days for that same time frame and display it as a percentage in the table.
In this example you could compare how the first hour of the trading day compares to the previous 30 day's average, aiding in evaluating the potential volume for the remainder of the day.
Notes:
Times must be entered in 24 hour format. (1pm = 13:00 etc.)
This indicator is for Intra-day time frames, not > Day.
If you prefer data in this format as opposed to a plotted line, check out my other indicator: ADR & ATR Overlay

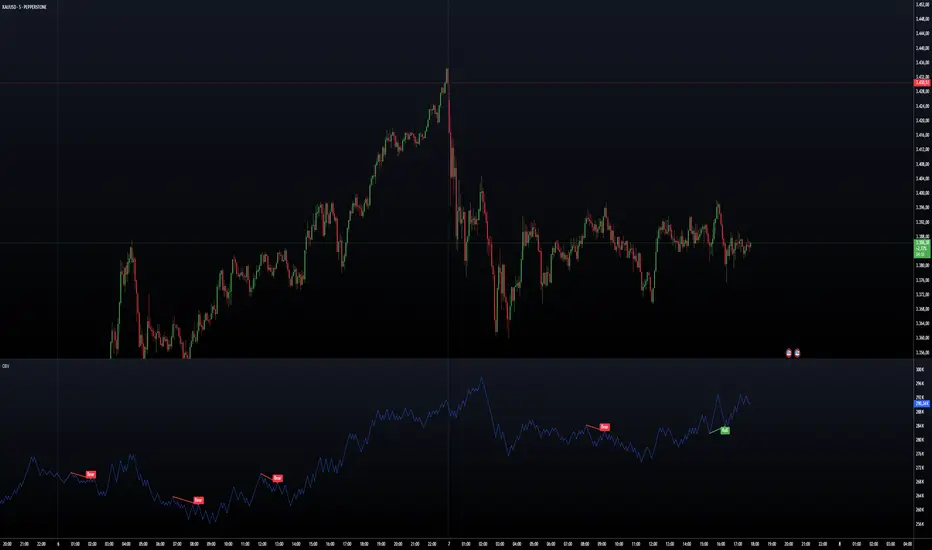
On Balance Volume W DivergenceOBV With Divergence Indicator
A comprehensive On Balance Volume (OBV) indicator enhanced with divergence detection capabilities.
Core Features:
Classic OBV calculation with volume-based price movement tracking
Advanced divergence detection system
Multiple smoothing options for OBV
Bollinger Bands integration
Technical Components:
Volume-based price movement analysis
Pivot point detection for divergence
Customizable lookback periods
Adjustable divergence range parameters
Customization Options:
Multiple Moving Average types (SMA, EMA, SMMA, WMA, VWMA)
Bollinger Bands with adjustable standard deviation
Divergence sensitivity settings
Visual customization for signals and alerts
The indicator combines traditional OBV analysis with modern divergence detection, offering traders a powerful tool for identifying potential trend reversals and market momentum shifts.
Key Parameters:
- Pivot Lookback Right/Left: 5 (default)
- Divergence Range: 5-60 bars
- MA Length: 14 (default)
- BB StdDev: 2.0 (default)
Alert System:
- Bullish divergence alerts
- Bearish divergence alerts
- Customizable alert messages
Note: The indicator requires volume data to function properly and will display an error if volume data is not available.
Volume Intelligence Suite (VIS) v2📊 Volume Intelligence Suite – Smart Volume, Smart Trading
The Volume Intelligence Suite is a powerful, all-in-one TradingView indicator designed to give traders deeper insight into market activity by visualizing volume behavior with price action context. Whether you're a scalper, day trader, or swing trader, this tool helps uncover hidden momentum, institutional activity, and potential reversals with precision.
🔍 Key Features:
Dynamic Volume Zones – Highlights high and low volume areas to spot accumulation/distribution ranges.
Volume Spikes Detector – Automatically marks abnormal volume bars signaling potential breakout or trap setups.
Smart Delta Highlighting – Compares bullish vs bearish volume in real time to reveal buyer/seller strength shifts.
Session-Based Volume Profiling – Breaks volume into key trading sessions (e.g., London, New York) for clearer context.
Volume Heatmap Overlay – Optional heatmap to show intensity and velocity of volume flow per candle.
Custom Alerts – Built-in alerts for volume surges, divergences, and exhaustion signals.
Optimized for Kill Zone Analysis – Pairs perfectly with ICT-style session strategies and Waqar Asim’s trading methods.
🧠 Why Use Volume Intelligence?
Most traders overlook the story behind each candle. Volume Intelligence Suite helps you "see the why behind the move" — exposing key areas of interest where smart money may be active. Instead of reacting late, this tool puts you in position to anticipate.
Use it to:
Validate breakouts
Detect fakeouts and liquidity grabs
Confirm bias during kill zones
Analyze volume divergence with price swings
⚙️ Fully Customizable:
From volume thresholds to visual styles and session timings, everything is user-adjustable to fit your market, timeframe, and strategy.
✅ Best For:
ICT/Smart Money Concepts (SMC) traders
Breakout & reversal traders
Kill zone session scalpers
Institutional footprint followers

Rogue ORB PRORogue ORB Pro is a precision-engineered Opening Range Breakout (ORB) indicator built for active intraday traders who need real signals, not noise.
This tool identifies high-probability breakout entries from the opening range, enhanced with optional ATR-based stop loss levels, deviation targets, cooldown filters, and a relative volume gate to filter weak setups.
🔍 Key Features:
Opening Range High/Low: Drawn from a user-defined time window and locked for the day
Deviations: Automatically plots target zones above and below the OR range (e.g. 1, 2 deviations)
Pre-Market Levels: Automatically draws pre market high and low lines at the end of pre market session
Buy/Sell Signals: Triggered on breakout of the OR High/Low with configurable breakout logic (touch or close)
ATR Stop Loss Line: Dynamically drawn at a fixed ATR distance from breakout candle, with optional SL label
Cooldown Period: Prevents back-to-back signals by enforcing a user-defined bar delay between entries, can help with overtrading
Volume Filter: Optional relative volume filter that requires breakout candles to exceed a custom volume threshold
VWAP Overlay: Visual VWAP for directional bias and confluence

RVOL Effort Matrix💪🏻 RVOL Effort Matrix is a tiered volume framework that translates crowd participation into structure-aware visual zones. Rather than simply flagging spikes, it measures each bar’s volume as a ratio of its historical average and assigns to that effort dynamic tiers, creating a real-time map of conviction , exhaustion , and imbalance —before price even confirms.
⚖️ At its core, the tool builds a histogram of relative volume (RVOL). When enabled, a second layer overlays directional effort by estimating buy vs sell volume using candle body logic. If the candle closes higher, green (buy) volume dominates. If it closes lower, red (sell) volume leads. These components are stacked proportionally and inset beneath a colored cap line—a small but powerful layer that maintains visibility of the true effort tier even when split bars are active. The cap matches the original zone color, preserving context at all times.
Coloration communicates rhythm, tempo, and potential turning points:
• 🔴 = structurally weak effort, i.e. failed moves, fake-outs or trend exhaustion
• 🟡 = neutral volume, as seen in consolidations or pullbacks
• 🟢 = genuine commitment, good for continuation, breakout filters, or early rotation signals
• 🟣 = explosive volume signaling either climax or institutional entry—beware!
Background shading (optional) mirrors these zones across the pane for structural scanning at a glance. Volume bars can be toggled between full-stack mode or clean column view. Every layer is modular—built for composability with tools like ZVOL or OBVX Conviction Bias.
🧐 Ideal Use-Cases:
• 🕰 HTF bias anchoring → LTF execution
• 🧭 Identifying when structure is being driven by real crowd pressure
• 🚫 Fading green/fuchsia bars that fail to break structure
• ✅ Riding green/fuchsia follow-through in directional moves
🍷 Recommended Pairings:
• ZVOL for statistically significant volume anomaly detection
• OBVX Conviction Bias ↔️ for directional confirmation of effort zones
• SUPeR TReND 2.718 for structure-congruent entry filtering
• ATR Turbulence Ribbon to distinguish expansion pressure from churn
🥁 RVOL Effort Matrix is all about seeing—how much pressure is behind a move, whether that pressure is sustainable, and whether the crowd is aligned with price. It's volume, but readable. It’s structure, but dynamic. It’s the difference between obeying noise and trading to the beat of the market.

Triple EMA + Volume/Price SignalsOverview
This script merges three exponential moving averages (EMA) with adaptive volume thresholds to identify high-confidence trends. Unlike basic volume indicators, it triggers signals only when volume exceeds both a user-defined absolute value (e.g., 500k) and a percentage increase (e.g., 5%) – reducing noise in volatile markets.
Key Features
Triple EMA System:
Short (9), Medium (21), and Long (50) EMAs for trend direction.
Bullish Signal: Short EMA > Medium EMA > Long EMA.
Bearish Signal: Short EMA < Medium EMA < Long EMA.
Dual-Threshold Volume Confirmation:
Absolute Volume: Highlight bars where volume exceeds X (e.g., 500,000).
Percentage Increase: Highlight bars where volume rises by Y% (e.g., 5%) vs. prior bar.
Users can enable/disable either threshold.
Customizable Alerts:
Trigger alerts only when both EMA alignment and volume conditions are met.
How It Works
Trend + Volume Synergy:
A bullish EMA crossover alone might be a false breakout. This script requires additional volume confirmation (e.g., 500k volume + 5% spike) to validate the move.
Flexibility: Adjust thresholds for different assets:
Stocks: Higher absolute volume (e.g., 1M shares).
Crypto: Smaller absolute volume but larger % spikes (e.g., 10%).
Usage Examples
Swing Trading:
Set EMA lengths to 20/50/200 and volume thresholds to 500k + 5% on daily charts.
Scalping:
Use 5/13/21 EMAs with 100k volume + 3% spikes on 5-minute charts.

Premarket VolumeTimeframe: Use on intraday charts (e.g., 1-minute, 5-minute) with extended hours enabled.
Behavior: The plot will appear at 4:00 AM, grow as volume accumulates, and disappear at 9:30 AM each day.
Relative Volume at TimeThe Relative Volume at Time indicator (RVOL) is a simple modification of the original Relative Volume at Time script available in TradingView’s public library. It doesn’t change how the indicator works but includes two small adjustments:
Added Color Options – The ability to customize the colors of the volume bars, which was important to me as I use this indicator all the time and wanted more visually suitable colors.
Renamed Short Title – The abbreviation "RVOL" replaces "RelVol", as it's a more commonly used term in trading.
Aside from these small tweaks, the indicator retains all of its original functionality, including the ability to set an anchor timeframe, choose between Regular and Cumulative volume calculation modes, and adjust unconfirmed volume for incomplete bars.
This version exists simply because I needed a more personalized display for an indicator that I rely on daily.
How It Works
The Relative Volume at Time indicator compares the current volume to the average volume at the same time in previous sessions. This helps determine if today’s activity is higher or lower than usual.
Examples
On a daily chart (1D timeframe, length = 10), each volume bar compares today's volume to the average volume at the same time over the last 10 days. If today’s volume is higher than usual at this moment, the bar will reflect that.
On an hourly chart (1H timeframe, length = 5), each hourly volume bar compares the current hour’s volume to the same hour in the past 5 days. If the 10 AM bar is high, it means today's 10 AM volume is greater than the average of the past 5 sessions at 10 AM.
On a weekly chart (1W timeframe, length = 8), the indicator compares this week’s volume to the average of the last 8 weeks. A higher bar means this week is seeing significantly more volume than usual.
This logic applies to any timeframe. It always compares the current volume to past volumes at the same point in time.
@Julien_Eche

Valorous VolumesIndicator to mark the significant Volumes:
HVE: Checks if the current volume sets a new overall record.
HVY: Checks if the current volume equals the highest volume over the past one year.
HVQ: Checks if the current volume equals the highest volume over the past three months.

Zanger Volume Ratio (ZVR)Zanger Volume Ratio (ZVR)
Credits:
Most of the underlying code and logic in this script have been adapted from the work originally published by The_Peaceful_Lizard
Overview
The Zanger Volume Ratio (ZVR) is a powerful indicator designed to reveal market dynamics by comparing current cumulative volume to an average determined over a historical look-back period. It uses the concept of relative volume to not only highlight unusual volume spikes, but also uses color to illustrate how today's trading compares to typical levels. This unique method of volume analysis was popularized by Dan Zanger - a trader known for turning $10,775 into $18,000,000 in less than two years - by identifying key shifts in market interest and volume behavior.
Key Features
Volume Pacing Analysis:
The script calculates a volume delta by comparing the cumulative volume at any given moment to an average derived over a user-defined lookback period (Default 20-day). The resulting percentage difference offers a clear visualization and insight into unusual volume activity.
Dynamic Visual Representation:
Choose between either “Columns” or “Area” plot styles to display the percent difference. Additionally, you have the option to switch between a standard plot or a background color display, with customizable transparency, ensuring the indicator fits seamlessly with your chart’s aesthetics.
Dashboard Integration:
A simple dashboard table is displayed on the chart, showcasing the current ZVR value in real-time. With user-configurable position, text size, alignment, and color options, this feature ensures that the key metric is always visible and easy to interpret.
Why Use the Zanger Volume Ratio?
The ZVR is more than just a volume indicator. It acts as a window into market sentiment by highlighting days when trading interest intensifies. Many traders believe that an unusually high volume ratio may confirm trend strength or signal a reversal, making the indicator a valuable tool when used in conjunction with other technical analysis methods.
Whether you’re monitoring stocks, commodities, or forex markets, the Zanger Volume Ratio offers an accessible yet sophisticated method to decode volume dynamics. Its practical design and real-time visual feedback provide traders of all experience levels with critical data to spot high-potential setups.
Chart Description
First Pane: normal Volume Indicator on the foreground, ZVR as Background colors
Second Pane: ZVR Indicator with Column Style (default)
First panel: normal volume indicator in foreground, ZVR as background colors
Second panel: ZVR indicator with column style (default)
Note: This indicator is intended for use on intraday charts only!

Volume PressureDraws the candle chart with colors to represent low, medium and high volumes. You get 3 colors for downward and 3 colors for upward movement. This will aid with immediately seeing the relative volume pushing the stock candle in the direction of movement.
You can control the percentage threshold for low and high volume. You also can change the colors to represent each volume level for upward and downward movement.
ICT Dealing RangeICT Dealing Range
This indicator identifies and plots ICT (Inner Circle Trader) Dealing Ranges - key institutional areas where smart money accumulates or distributes positions before significant moves.
What is a Dealing Range?
A Dealing Range is a significant price area where institutional traders accumulate or distribute their positions. These ranges form through a specific sequence of price movements that indicate institutional order flow:
Bullish Dealing Range Sequence:
1. Initial High (H)
2. Initial Low (L)
3. Higher High (HH)
4. Lower Low (LL)
5. Break above HH (confirmation)
Bearish Dealing Range Sequence:
1. Initial Low (L)
2. Initial High (H)
3. Lower Low (LL)
4. Higher High (HH)
5. Break below LL (confirmation)
My Trading Strategy
Entry Methods:
1. Range Extreme Retests:
- After range formation, wait for price to return to either extreme
- Long entries at range bottom with stops below
- Short entries at range top with stops above
2. Mid-Line Strategy:
- Use the mid-line as a pivot point for reversals
- Long entries on mid-line bounce with stops below
- Short entries on mid-line rejection with stops above
Stop Loss Placement:
- When entering at extremes: Place stops beyond the mid
- When entering at mid-line: Place stops beyond the opposing extreme
- Always respect the structure's boundaries
Take Profit Targets:
- Minimum 2:1 Risk-Reward ratio
- For extreme entries: Target the opposite extreme
- For mid-line entries: Target the nearest extreme
Risk Management
- Never enter without a clear invalidation point
- Maintain minimum 2:1 RR ratio
- Consider market structure and higher timeframe context
Indicator Features
- Auto-detection of dealing range patterns
- Color-coded boxes (green for bullish, red for bearish)
- Optional mid-line display
- Customizable colors and styles
- Adjustable pivot lookback periods
Notes
This tool is based on ICT concepts but should be used in conjunction with other forms of analysis. The dealing range provides a framework for understanding institutional order flow, but proper risk management and market context are essential for successful trading.
Remember: The best trades often come from clean retests of these ranges after their initial formation. Patience in waiting for proper setups is key to successful implementation.

5x Volume indicator - Day Trading5x Volume Screener - Day Trading
Version: 6.0
Description:
This indicator is designed to identify significant volume spikes in crypto and stock markets,
specifically targeting instances where volume exceeds 5x the average of a 10-period Simple Moving Average (SMA) as the baseline.
Perfect for day traders and momentum traders looking for high-volume breakout opportunities.
Key Features:
Tracks real-time volume compared to 5-period moving average
Visual alerts through green histogram bars for 5x volume spikes
Dynamic volume ratio display showing exact multiple of average volume
Clear threshold line for quick reference
Optional labels showing precise volume ratios
Benefits:
Instantly spot unusual volume activity
Identify potential breakout opportunities
Validate price movements with volume confirmation
Perfect for day trading and scalping
Works across multiple timeframes
Best Used For:
Day trading setups
Breakout trading
Volume confirmation
Momentum trading
Market reversal identification
Created by: CigarSavant
Last Updated: December 2024
