Stochastic with False bar R2-2 by JustUncleLThis study project is an updated version of the implementation of the "Stochastic False BAR" indicator.
Description:
The standard Stochastic buy/sell indications come from Stochastic crosses about the standard overbought/oversold zones (80/20). This does not always work and you get stuck in the OB/OS zones with a trend continuation. Utilising a second much longer length Stochastic, the "False BAR" (Black) indicates when it is unsafe to take Stochastic cross over trades. Where the false bar does not appear (aqua, no background highlighing), the overbought / oversold conditions of the Stochastic can be considered higher-probability reversal areas and thus trading opportunities.
This Revision:
Added options to enable/disable False Bar lines and Stochastic trends.
Added options to modify upper and lower limits of false bar Stochastic and trading stochastic trend.
Added option to show the trading Stochastic as coloured Ribbon.
Added name titles for all plots
Added Background highlighting for False Bar.
Ribbon

Pullback Trading Tool R5-65 by JustUncleLBy request this is an updated version of the "PullBack Trading Tool": removes experimental "OCC" channel, added option to display ribbons or just single moving average lines, added alert arrows for "PB" exits, added alertcondition for TV alarm subsystem, added some extract options for Pivot points and general cleanup of code.
Description:
This project incorporates the majority of the indicators needed to analyse and trade Trends for Pullbacks, swings and reversals.
Incorporated within this tool are the following indicators:
1. Major industry (Banks) recognised important EMAs in an EMA Ribbon:
Lime = EMA5 (Optional Display)
DodgerBlue = EMA12 (Optional Display)
Red = EMA36 (Optional display)
Green = EMA89
Blue = EMA200
Black = EMA633
2. The 5 EMA (default) High/Low/Close Price Action Channel (PAC), the PAC channel display is disabled by default.
3. Optionally display Fractals and optional Fractal levels
4. Optional HH, LH, LL, HL finder.
5. Optional Buy/Sell "PB" exit Alerts with Optional 200EMA filter.
6. Coloured coded Bar high lighting based on the PAC:
blue = bar closed above PAC
red = bar closed below PAC
gray = bar closed inside PAC
7. Alert condition sent to TradingView's Alarm subsystem for PB exits.
8. Pivot points with optional labels.
9. EMA5-12 Ribbon is displayed by default.
10.EMA12-36 Ribbon is displayed by default
Set up and hints:
I am unable to provide a full description here, as Pullback Trading incorporates a full trading Methodology, there are a number of articles and books written on the subject.
Set the chart to Heikin Ashi Candles (optional).
I also add a "Sweetspot Gold R3" indicator to the chart as well to help with support and resistance finding and shows where the important "00" lines are.
First on a weekly basis say Sunday night or Monday morning, analyse the Daily and Weekly charts to establish overall trends, and support/resistant levels. Draw significant mini trend lines (2/3 TL), vertical trend lines (VTL) and S/R levels. Can use the Pivots points to guide VTL drawing and Fractals to help guide 2/3 TL drawing.
Once the trend direction and any potential major reversals highlighted, drop down to lower timeframe chart and draw appropriate mini Trend line (2/3 TL) matching the established momentum direction. Take note of potential pull backs from and of the EMAs, in particular the EMA5-12 ribbon, EMA12-36 Ribbon and the 200EMA. Can use the Pivots and/or Fractals points to guide your 2/3 TL drawing.
Set a TradingView alarm on the "PBTOOL alert", with the default settings this normally occurs before or during the Break of the manually drawn TL lines.
Once alerted check to see if the TL is broken and is returning to trend away from the EMA lines, this is indicated by bar colour change to trend directional colour.
You can trade that alert or drop down to even lower time frames and perform the same TL analysis there to find trades at the lower TF. Trading at lower TF you will allow tighter Stop loss settings.
Other than the "SweetSpot Gold R3" indicator, you should not need any other indicator to successfully trade trends for Pullbacks and reversals. If you really want another indicator I suggest a momentum one for example: AO ( Awesome Oscillator ), MACD or Squeeze Momentum.

Multiple Moving Averages using only 1 Indicator!Multiple moving averages in one indicator, so those of you without a pro membership can add multiple moving averages to your chart while only taking up 1 of the 3 indicators.

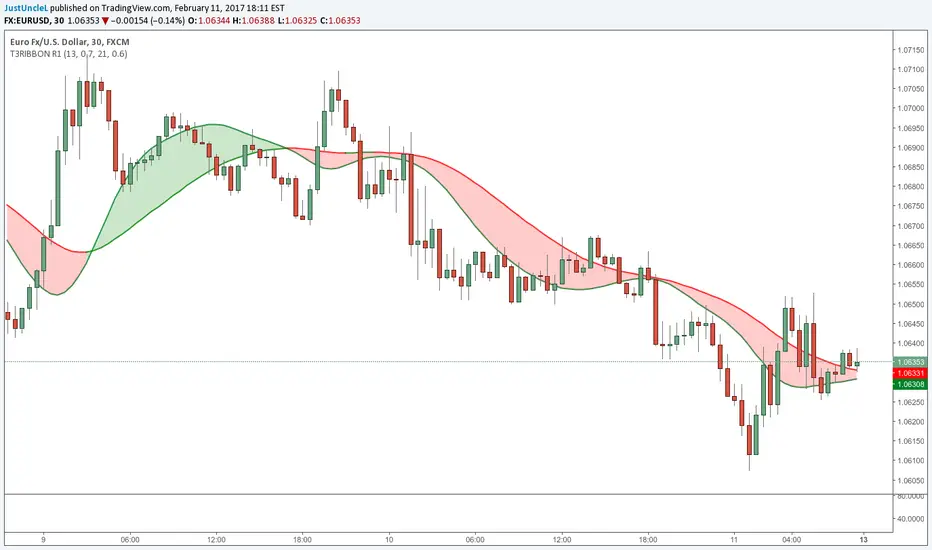
T3MA Ribbon R1 by JustUncleLThis study draws a T3 Moving average Coloured Ribbon based on a Fast and Slow T3 MAs. Combine with an alert indicator like "Traders Dynamic Index Indicator Alert v0.1 by JustUncleL" to get a good trading method (See my comment following).
Moving Average RibbonThis is an extension of the Madrid Moving Average Ribbon public script to allow for different kinds of moving averages (the original allows only exponential and simple). Possible entries in the MA Type argument field are:
sma (simple moving average)
ema (exponential moving average)
wma (weighted moving average)
trima (triangular moving average)
zlema (zero-lag exponential moving average)
dema (double exponential moving average)
tema (triple exponential moving average)
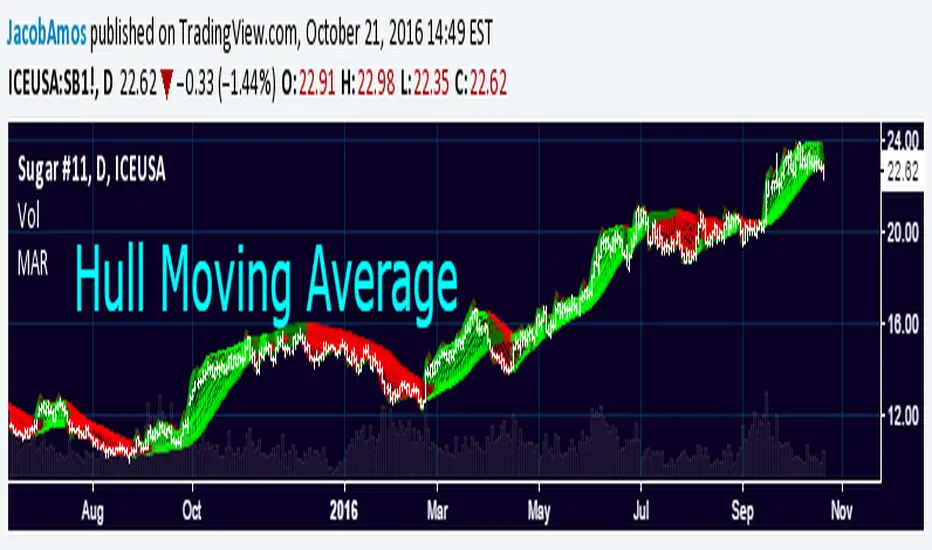
hma (hull moving average)
If the argument given by the user does not match anything from the above list, it will default to ema.
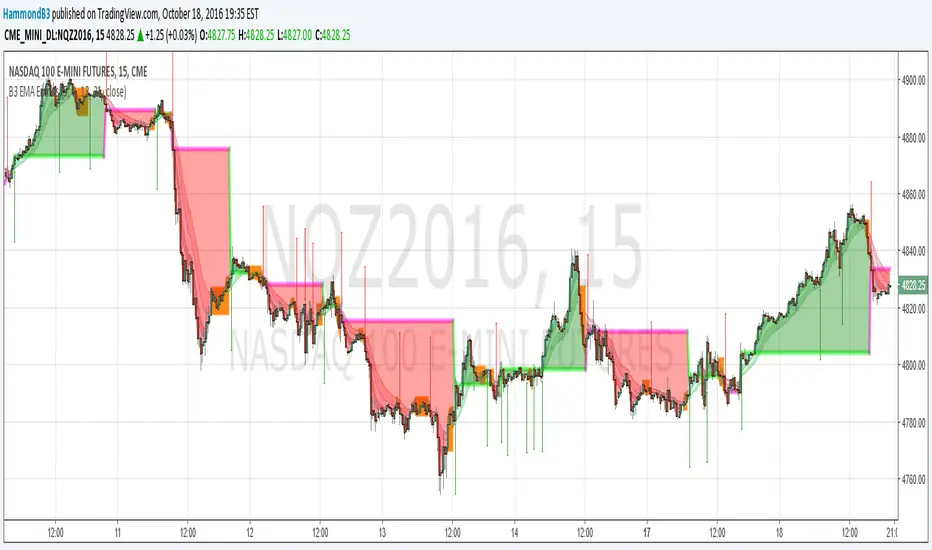
B3 EMA EntriesB3 EMA Entries = B3 EMA Ribbon "Trader"
This study takes the B3 EMA Ribbon and builds trade entries from it. The clouds represent the deviation from entry points; orange equals weakening or undetermined trend. Manage your own exits, and if you have a large deviation cloud in comparison to prior clouds.... take them profits!
Here also is a glimpse into my proprietary scripting that I will likely offer for a subscription at some point. Many simpler freebies like this share to come first of course! I will give away most simple indicators, but there are a few sub-chassis things I use, which I developed myself. One of which is indicator back testing, where I see all of the strategy's history information from the indicator on the chart. Sans trade-ticket automation, this voids the need for a strategy file or A.P.I. or backtesting devices (however, I plan to adapt things to TradingView's strategy system if I can, so that automation can take place). As well as this algorithmic trading system chassis, I also have a specialized statistical output chassis and another few graphical depiction sets.
For this share, you should manage your own exits, (you could simply use the orange clouds as an exit.) This is my most simple of the "indicator traders" I call them. The more intricate algorithmic trading indicators I make have the full trading package down to the risk to reward, entry, target, stop, and trail. The statistical systems are pretty unique, and I haven't seen many doing what I do on that front yet, so I am excited to get those out to more people. Look for these subscriptions in the near future, but as a token of introduction enjoy my next several free shares too.
Cheers, and good trades to you. ~B3
B3 EMA RibbonAs a person versed in other languages of script, I am sharing my first pinescript. I have just thrown together some EMA lines and testing out the fill() function. I have some 400+ indicators I could make and share, so cheers to many more! As I get more versed in the language, I will make more intricate studies based on high math and sound strategy.

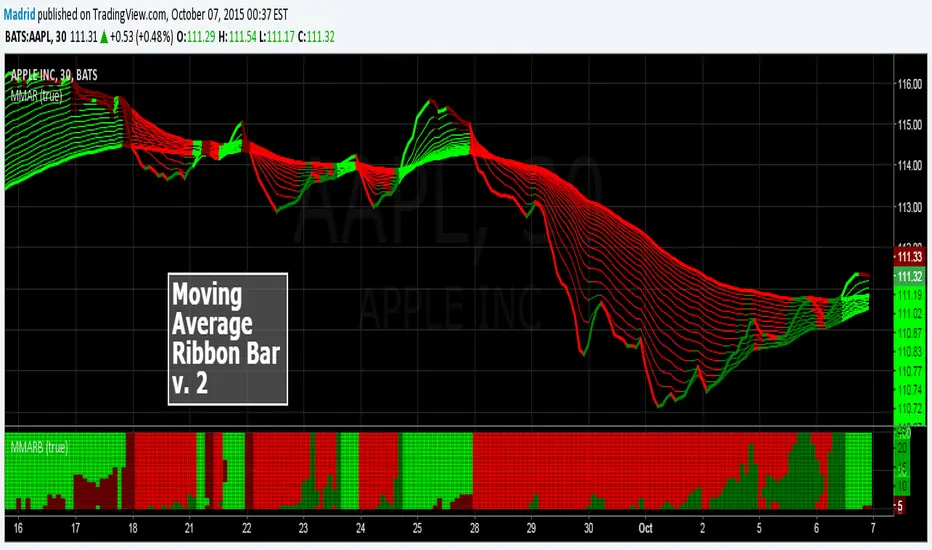
Madrid MA Ribbon Bar v2This script is the second version of the Moving average Ribbon Bar, a companion study of the MA Ribbon. In this version the display is changed, instead of lines, it display the results in stacked bars, making it more user friendly and allowing it to be expanded or contracted without loosing visual continuity.
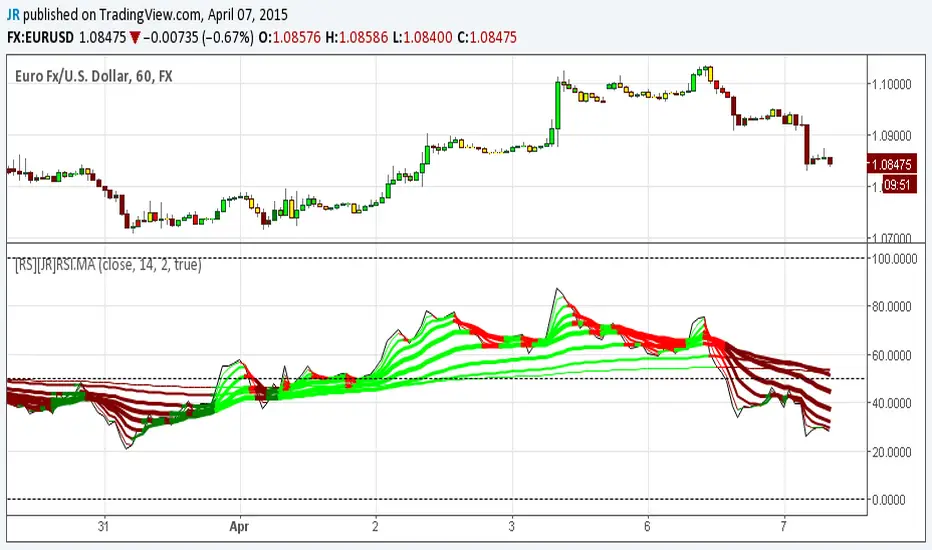
[RS][JR]RSI Ribbon + CandleRSI Ribbon + Candle
By Ricardo Santos and JR
In this chart rendering we are combining RSI and Moving Averages. For an added features we included colors to the candles and ribbons. Lime and green displays a strong bullish trend, yellow is caution or no trade, red and maroon are bearish trends. You can also find divergences using the ribbon.
Divergence
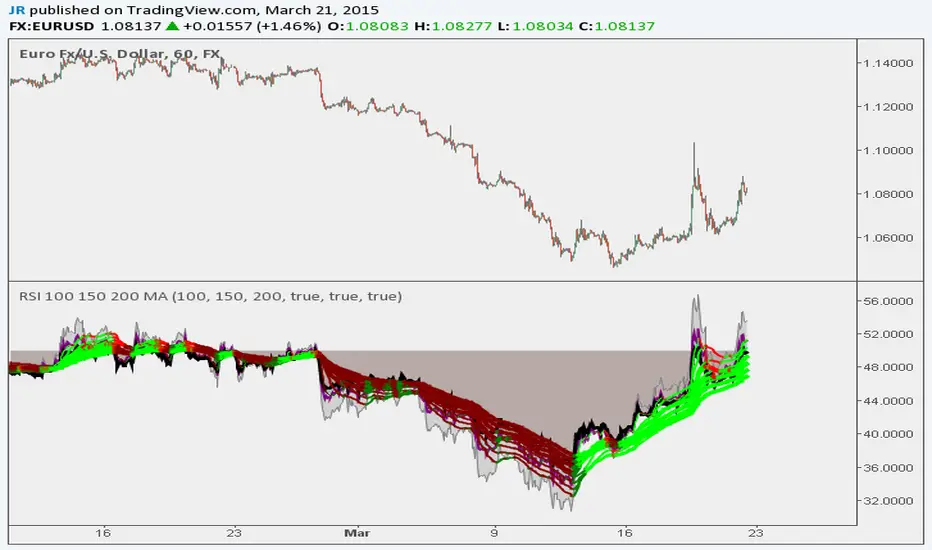
RSI 100 150 200 MA Ribbon
Following Trends and Finding Divergences
Here is a script example that uses a long length (100, 150, 200) RSI MA Ribbon to detect trend reversals using lower time frames. You can also use traditional RSI to find divergences.
Built Best for 1H to 10 Min Charting
BTCUSD
Madrid Moving Average RibbonThis plots a moving average ribbon, either exponential or standard. It provides an easy and fast way to determine the trend direction and possible reversals.
Lime : Uptrend. Long trading
Maroon : Reentry (buy the dip) or downtrend reversal warning
Red : Downtrend. Short trading
Green : Short Reentry (sell the peak) or uptrend reversal warning
To best determine if this is a reentry point or a trend reversal the MMARB (Madrid Moving Average Ribbon Bar) study is used. This is the bar located at the bottom. This bar signals when a current trend reentry is found (partially filled with opposite dark color) or when a trend reversal is ahead (completely filled with opposite dark color).
This study requires no parameters, and it can be used on any time frame.
I hope this effort can help you in your trading.

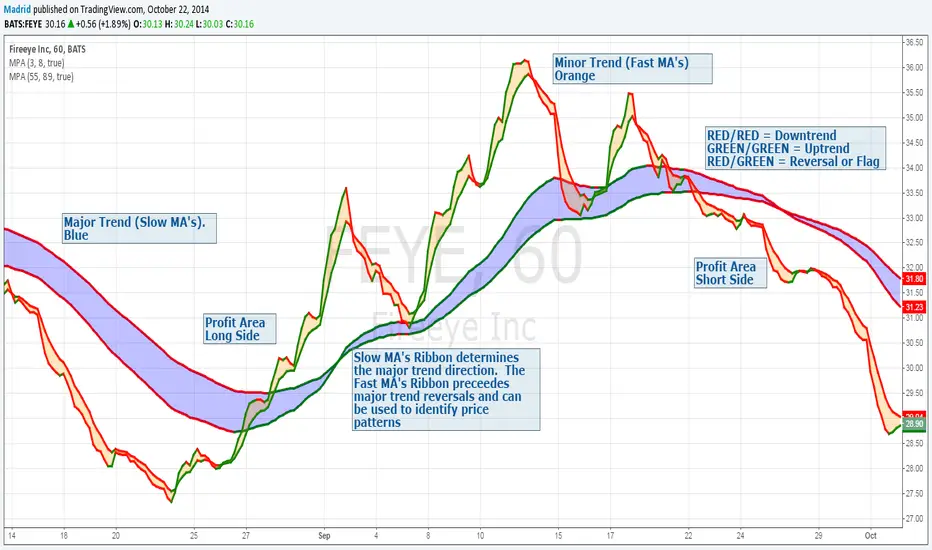
Madrid Profit AreaThis study displays a ribbon made of two moving averages identified by a filled Area. This provides visual aids to determine the trend direction and pivot points. The moving average will be Red if its value is decreasing, and green if it is increasing. When both MA's are the same color we have a trend direction. If those are different then we have a trend reversal and a pivot point.
If combined with another ribbon then it can be configured so we have a pair of slow MA's and another pair of fast MA's , this can visually determine if the price is in bull or bear territory following the basic rules:
1. Fast MA pair above the slow MA Pair = Bullish
2. Fast MA pair below the slow MA Pair = Bearish
3. If the fast MA crosses over the slow MA it is a Bullish reversal
4. If the fast MA crosses below the the slow MA, it is a Bearish reversal.
The use of the ribbons without the price bars or line reduces the noise inherent to the price