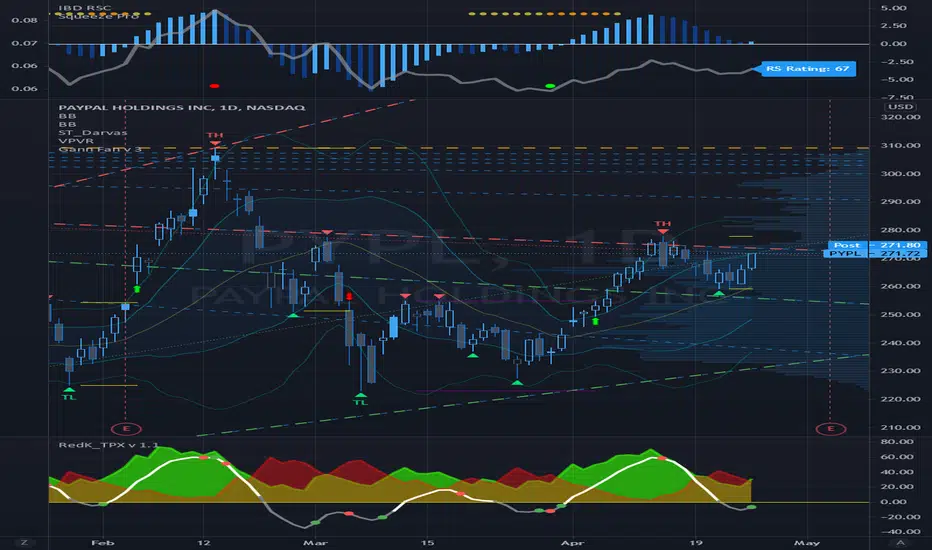
Gann Fan Analysis v 3.0The openness of this community is amazing and I have gained a lot from being a member. Hopefully you think this is useful so I can give something back.
This indicator constructs a reference framework of Support and Resistance levels based on Gann Fan ratios. Two fans are created: Support or Bullish fan, and a Resistance or Bearish fan. The origin of the analysis is the lowest pivot in the analysis window set by the length input. The upper bound of the analysis is the highest pivot in the analysis window. This is the only user input that affects the fan calculation. The remaining user input controls the visualization of the fans. The fan calculations are updated as the high and low within the analysis window change. The resistance fan range is based on an assumed 70% retracement.
Indicator also highlights the active Support and Resistance lines of each fan. An alert is also included, based on the price crossing one of these active levels.
Currently I can't figure out how to get the analysis to extend beyond 278 or so bars (not sure what the limitation is) so it isn't really useful for intraday timeframes, but it is reliable on daily and above. I use it on a Weekly view with the analysis length set to 52, and on a daily timeframe with the length set to 260.
I included fractal visualization using Ricardo Santos' Fractals v9 script as a means of confirming the Gann Fan pivots. The two methods seems to correlate well, in my opinion.
The coding is terrible, I'm sure, so please overlook that as this my first complex effort. I'm a total amateur!
"pivot"に関するスクリプトを検索
Divergence for Many Indicators v4Hello Traders,
Here is my new year gift for the community, Digergence for Many Indicators v4 . I tried to make it modular and readable as much as I can. Thanks to Pine Team for improving Pine Platform all the time!
How it works?
- On each candle it checks divergences between current and any of last 16 Pivot Points for the indicators.
- it search divergence on choisen indicators => RSI , MACD , MACD Histogram, Stochastic , CCI , Momentum, OBV, VWMACD, CMF and any External Indicator !
- it checks following divergences for 16 pivot points that is in last 100 bars for each Indicator.
--> Regular Positive Digergences
--> Regular Negative Digergences
--> Hidden Positive Digergences
--> Hidden Negative Digergences
- for positive divergences first it checks if closing price is higher than last closing price and indicator value is higher than perious value, then start searching divergence
- for negative divergences first it checks if closing price is lower than last closing price and indicator value is lower than perious value, then start searching divergence
Some Options:
Pivot Period: you set Pivot Period as you wish. you can see Pivot Points using "Show Pivot Points" option
Source for Pivot Points: you can use Close or High/Low as source
Divergence Type: you can choose Divergence type to be shown => "Regular", "Hidden", "Regular/Hidden"
Show Indicator Names: you have different options to show indicator names => "Full", "First Letter", "Don't Show"
Show Divergence Number: option to see number of indicators which has Divergence
Show Only Last Divergence : if you enable this option then it shows only last Positive and Negative Divergences
you can include any External Indicator to see if there is divergence
- enable "Check External Indicator"
- and then choose External indicator name in the list, "External Indicator"
- External indicator name is shown as Extrn
- related external indicator must be added before enabling this option
Coloring, line width and line style options for different type of divergences.
Following Alerts added:
- Positive Regular Divergence Detected
- Negative Regular Divergence Detected
- Positive Hidden Divergence Detected
- Negative Hidden Divergence Detected
Now lets see some examples:
Hidden Divergences:
Regular and Hidden Divergences together:
Showing first letters of indicators:
You can see only the number of indicators which has divergence:
You can see only divergence lines without indicators names and numbers:
option to used different label/line/text colors:
You have option to see only last divergences:
You can change Pivot Period, in following example Pivot Period = 15:
You can use Close or High/Low as Source for Divergence
You can include external indicators and get divergences on it:
Wish you all a happy new year!
Enjoy!

Murrey Math Lines with extreme compartor and pivot pointsI did combine 3 scripts into one that really shows a lot. This is to bring together other good ideas to show improve on others work. Special thanks to pipcharlie for the murrey math lines Mage3 for the pivot points and morpheous747 for the murrey extreme compartor.
// this script shows sveral things.
//1. Breakouts - multiple diamonds and price staying in the outer murrey bands is a strong trend. This will lead to a double top or bottom. You could also buy/sell
// the pullbacks and expext another diamond.
//2. Tops - 2 pivots in the top murrey bands first top must have a diamond second must be in the top murrey zone or a higher murrey outer band without a diamond.
// There also must have a dip between tops outside the top murrey zone.
//3. bottoms bounces - a quick pull back if there are 2 pivots close together and the second pivot is not a diamond.
//4. double bottoms - 2 pivots with the first pivot a diamond. The second is after a pullback out of the bottom murrey zone and a diamond.
//5. pullbacks - red and green lines. These are a little more benificial for tops/bottoms
//6. Overall trends - the triangles on top or bottoms show overall general trend. Also the murrey bands act like bollinger bands, once trend changes, expect targets
// to hit the opposite band.
//7. Pivots - adding pivots and extentions help determine trends, resistance levels and tops/bottoms\
//8. Volitility - the wider the murry bands the more movement is likely and ususally in trend with stronger pullbacks. The smaller the bands smaller moves and more
// up and down movement

Change in State of Delivery CISD [AlgoAlpha]🟠 OVERVIEW
This script tracks how price “changes delivery” after failed attempts to push in one direction. It builds swing levels from pivots, watches for those levels to be wicked, and then checks if price delivers cleanly in the opposite direction. When the pattern meets the script’s tolerance rules, it marks a Change in State of Delivery (CISD). These CISD levels are drawn as origin lines and are used to spot shifts in intent, failed pushes, and continuation attempts. A CISD becomes stronger when it forms after opposing liquidity is swept within a defined lookback.
🟠 CONCEPTS
The script first defines structure using swing highs/lows. These levels act as potential liquidity points. When price wicks through a swing, the script registers a mitigation event. After this, it looks for a reversal-style candle sequence: a failed push, followed by a counter-move strong enough to pass a tolerance ratio. This ratio compares how far price expanded away from the failed attempt versus the counter-move that followed. If the ratio is high enough, this becomes a CISD. The idea is simple: liquidity interaction sets context , and the tolerance logic identifies actual intent . CISD levels and sweep markers combine these two ideas into a clean map of where delivery flipped.
🟠 FEATURES
Liquidity tracking: marks swing highs/lows and updates them until expiry
Liquidity sweep confirmation when CISD aligns with recent mitigations
Alert conditions for all key events: mitigations, CISDs, and strong CISDs
🟠 USAGE
Setup : Add the script to your chart. Use it on any timeframe where swing behavior matters. Set the Swing Period for how wide a pivot must be. Set Noise Filter to control how strict the CISD detection is. Liquidity Lookback defines how recent a wick must be to confirm a sweep.
Read the chart : Origin lines mark where the CISD began. A green line signals bullish intent; a red line signals bearish intent. ▲ and ▼ shapes show CISDs that form after liquidity is swept, these mark strong signals for potential entry. Swing dots show recent swing highs/lows. Candle colors follow the latest CISD trend.
Settings that matter : Increasing Swing Period produces fewer but stronger swings. Raising Noise Filter requires cleaner counter-moves and reduces false CISDs. Liquidity Lookback controls how strict the sweep confirmation is. Expiry Bars decides how long swing levels remain active.

VWAP – Pivot Pairs (SECONDS‑BASED RESET)VWAP – Pivot Pairs (SECONDS-BASED RESET) is a Pine Script v6 indicator for TradingView that combines pivot-based breakout detection with resettable VWAP (Volume Weighted Average Price) calculations over user-defined rolling time periods in seconds.It identifies high and low swing pivots via breakout logic, then calculates two VWAP lines per anchor:One using high/low as the price source,
One using close as the price source.
These form "pivot pairs" that reset automatically at the start of each custom-duration period (e.g., every 300 seconds), starting from a user-defined UTC time of day (default: 09:30 UTC).Visuals include:Colored VWAP lines (high pair: red, low pair: green),
Semi-transparent fill zones between each pair,
Optional toggles to show/hide high or low pairs.
Use CasesUse Case
Description
Intraday Scalping (1–15 min charts)
Use 60–300 second resets to capture micro-trends within larger sessions. VWAP pairs act as dynamic support/resistance after breakouts.
High-Frequency / Algo Validation
Backtest strategies on tick/second charts where traditional session resets fail. Align resets with exchange micro-sessions or volatility windows.
Opening Range Breakout (ORB) Enhancement
Set period_seconds = 1800 (30 min) and start time = 09:30 UTC → VWAP builds only on first 30 mins post-open, then floats. Pairs show deviation from ORB mean.
Range-Bound Market Analysis
In choppy markets, VWAP pairs converge near fair value. Divergence signals potential breakout. Fill color intensity shows conviction.
Multi-Timeframe Confluence
Overlay on 1-second chart with 300s reset → matches 5-minute structure. Use close-based VWAP for entries, high/low-based for stops.
Key Features SummaryFeature
Function
period_seconds
Rolling window length in seconds (e.g., 300 = 5 min)
period_start_time
UTC time-of-day anchor (default: 09:30)
new_period logic
Triggers full reset of pivots + VWAP on exact second boundary
breakingHigher / breakingLower
Detects confirmed breakouts (not just close above high)
Dual VWAP per anchor
ta.vwap(high) and ta.vwap(close) for range-aware mean
Fill zones
Visual value area between high/close VWAPs
Toggle visibility
Independently show/hide high or low pivot pairs
How It Works – Step-by-StepTime Engine Converts user inputs → milliseconds
Calculates current period start time using integer division from epoch
Detects exact bar when new period begins (new_period = true)
On New Period Resets both high/low anchors to current bar’s h and l
Forces VWAP recalculation from this bar forward
Breakout Detection Only triggers on strong candles (rising/falling, non-doji)
Requires open/close beyond prior pivot → avoids wicks-only breaks
VWAP Accumulation ta.vwap(source, reset_condition) restarts when anchor resets
Two sources per side → shows where volume clustered (at highs vs closes)
Plotting Four lines + two fills
Clean, customizable, overlay-friendly
Pro TipsUse on Heikin Ashi for smoother breakout signals.
Combine with volume profile to validate VWAP clusters.
For crypto, set period_start_time = 0 (00:00 UTC) for clean 4-hour resets.
Add alerts on new_period or breakingHigher for automation.
In short: This is a precision VWAP tool for time-boxed, pivot-driven mean reversion and breakout trading, ideal for scalpers, day traders, and algo developers needing sub-session granularity.

Volume Weighted Intra Bar LR Standard DeviationThis indicator analyzes market character by providing a detailed view of volatility. It applies a Linear Regression model to intra-bar price action, dissecting the total volatility of each bar into three distinct components.
Key Features:
Three-Component Volatility Decomposition: By analyzing a lower timeframe ('Intra-Bar Timeframe'), the indicator separates each bar's volatility into:
Trend Volatility (Green/Red): Volatility explained by the intra-bar linear regression slope (Momentum).
Residual Volatility (Yellow): Volatility from price oscillating around the intra-bar trendline (Mean-Reversion).
Within-Bar Volatility (Blue): Volatility derived from the range of each intra-bar candle (Noise/Choppiness).
Layered Column Visualization: The indicator plots these components as a layered column chart. The size of each colored layer visually represents the dominance of each volatility character.
Dual Display Modes: The indicator offers two modes to visualize this decomposition:
Absolute Mode: Displays the total standard deviation as the column height, showing the absolute magnitude of volatility and the contribution of each component.
Normalized Mode: Displays the components as a 100% stacked column chart (scaled from 0 to 1), focusing purely on the percentage ratio of Trend, Residual, and Noise.
Calculation Options:
Statistical Model: The 'Estimate Bar Statistics' option (enabled by default) uses a statistical model ('Estimator') to perform the decomposition. (Assumption: In this mode, the Source input is ignored, and an estimated mean for each bar is used instead).
Normalization: An optional 'Normalize Volatility' setting calculates an Exponential Regression Curve (log-space).
Volume Weighting: An option (Volume weighted) applies volume weighting to all intra-bar calculations.
Multi-Component Pivot Detection: Includes a pivot detector that identifies significant turning points (highs and lows) in both the Total Volatility and the Trend Volatility Ratio. (Note: These pivots are only plotted when 'Plot Mode' is set to 'Absolute').
Note on Confirmation (Lag): Pivot signals are confirmed using a lookback method. A pivot is only plotted after the Pivot Right Bars input has passed, which introduces an inherent lag.
Multi-Timeframe (MTF) Capability:
MTF Analysis: The entire intra-bar analysis can be run on a higher timeframe (using the Timeframe input), with standard options to handle gaps (Fill Gaps) and prevent repainting (Wait for...).
Limitation: The Pivot detection (Calculate Pivots) is disabled if a Higher Timeframe (HTF) is selected.
Integrated Alerts: Includes 9 comprehensive alerts for:
Volatility character changes (e.g., 'Character Change from Noise to Trend').
Dominant character emerging (e.g., 'Bullish Trend Character Emerging').
Total Volatility pivot (High/Low) detection.
Trend Volatility pivot (High/Low) detection.
Caution! Real-Time Data Behavior (Intra-Bar Repainting) This indicator uses high-resolution intra-bar data. As a result, the values on the current, unclosed bar (the real-time bar) will update dynamically as new intra-bar data arrives. This behavior is normal and necessary for this type of analysis. Signals should only be considered final after the main chart bar has closed.
DISCLAIMER
For Informational/Educational Use Only: This indicator is provided for informational and educational purposes only. It does not constitute financial, investment, or trading advice, nor is it a recommendation to buy or sell any asset.
Use at Your Own Risk: All trading decisions you make based on the information or signals generated by this indicator are made solely at your own risk.
No Guarantee of Performance: Past performance is not an indicator of future results. The author makes no guarantee regarding the accuracy of the signals or future profitability.
No Liability: The author shall not be held liable for any financial losses or damages incurred directly or indirectly from the use of this indicator.
Signals Are Not Recommendations: The alerts and visual signals (e.g., crossovers) generated by this tool are not direct recommendations to buy or sell. They are technical observations for your own analysis and consideration.

Volume Weighted LR Standard DeviationThis indicator analyzes market character by decomposing total volatility into three distinct, interpretable components based on a Linear Regression model.
Key Features:
Three-Component Volatility Decomposition: The indicator separates volatility based on the 'Estimate Bar Statistics' option.
Standard Mode (Estimate Bar Statistics = OFF): Calculates volatility based on the selected Source (dies führt hauptsächlich zu 'Trend'- und 'Residual'-Volatilität).
Decomposition Mode (Estimate Bar Statistics = ON): The indicator uses a statistical model ('Estimator') to calculate within-bar volatility. (Assumption: In this mode, the Source input is ignored, and an estimated mean for each bar is used instead). This separates volatility into:
Trend Volatility (Green/Red): Volatility explained by the regression's slope (Momentum).
Residual Volatility (Yellow): Volatility from price oscillating around the regression line (Mean-Reversion).
Within-Bar Volatility (Blue): Volatility from the high-low range of each bar (Noise/Choppiness).
Dual Display Modes: The indicator offers two modes to visualize this decomposition:
Absolute Mode: Displays the total standard deviation as a stacked area chart, partitioned by the variance ratio of the three components.
Normalized Mode: Displays the direct variance ratio (proportion) of each component relative to the total (0-1), ideal for identifying the dominant market character.
Calculation Options:
Normalization: An optional 'Normalize Volatility' setting calculates an Exponential Regression Curve (log-space), making the analysis suitable for growth assets.
Volume Weighting: An option (Volume weighted) applies volume weighting to all regression and volatility calculations.
Multi-Component Pivot Detection: Includes a pivot detector that identifies significant turning points (highs and lows) in both the Total Volatility and the Trend Volatility Ratio. (Note: These pivots are only plotted when 'Plot Mode' is set to 'Absolute').
Note on Confirmation (Lag): Pivot signals are confirmed using a lookback method. A pivot is only plotted after the Pivot Right Bars input has passed, which introduces an inherent lag.
Multi-Timeframe (MTF) Capability:
MTF Volatility Lines: The volatility lines can be calculated on a higher timeframe, with standard options to handle gaps (Fill Gaps) and prevent repainting (Wait for...).
Limitation: The Pivot detection (Calculate Pivots) is disabled if a Higher Timeframe (HTF) is selected.
Integrated Alerts: Includes 9 comprehensive alerts for:
Volatility character changes (e.g., 'Character Change from Noise to Trend').
Dominant character emerging (e.g., 'Bullish Trend Character Emerging').
Total Volatility pivot (High/Low) detection.
Trend Volatility pivot (High/Low) detection.
DISCLAIMER
For Informational/Educational Use Only: This indicator is provided for informational and educational purposes only. It does not constitute financial, investment, or trading advice, nor is it a recommendation to buy or sell any asset.
Use at Your Own Risk: All trading decisions you make based on the information or signals generated by this indicator are made solely at your own risk.
No Guarantee of Performance: Past performance is not an indicator of future results. The author makes no guarantee regarding the accuracy of the signals or future profitability.
No Liability: The author shall not be held liable for any financial losses or damages incurred directly or indirectly from the use of this indicator.
Signals Are Not Recommendations: The alerts and visual signals (e.g., crossovers) generated by this tool are not direct recommendations to buy or sell. They are technical observations for your own analysis and consideration.

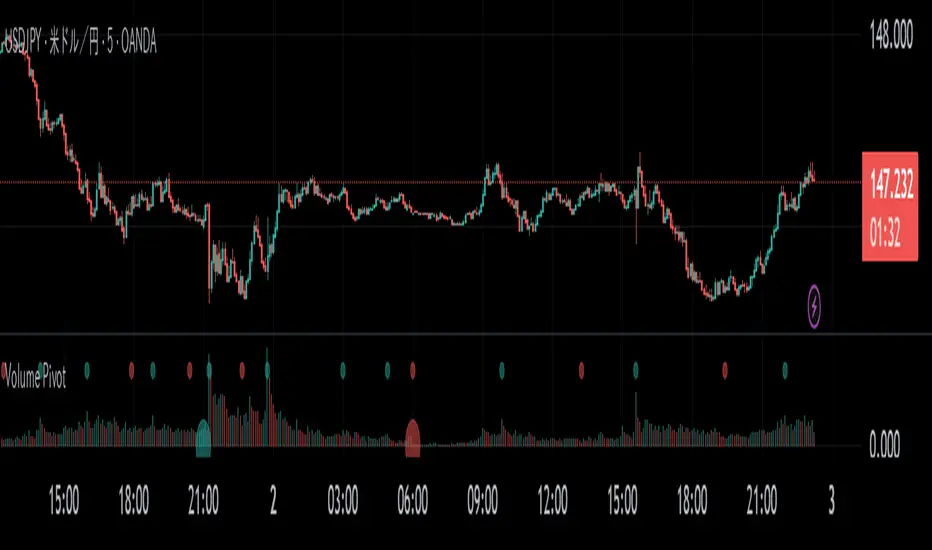
Volume PivotOVERVIEW
Volume Pivot is a technical analysis tool for TradingView designed to identify key turning points in the market by focusing on volume rather than price. It detects peaks and troughs (pivots) in trading volume to pinpoint moments of maximum market interest or exhaustion.
This indicator performs its analysis on both the Current Timeframe (CTF) and a user-defined Higher Timeframe (HTF). This dual-perspective approach allows traders to simultaneously grasp short-term market reactions and long-term structural shifts, leading to more informed and high-conviction trading decisions.
FEATURES
Automatic Pivot Detection
Automatically identifies and plots Volume Pivot Highs (peaks) and Pivot Lows (troughs) based on a user-defined Lookback Length.
Dual Timeframe Display
- CTF Signals : Plotted as tiny circles directly above the corresponding volume bars for immediate, short-term context.
- HTF Signals : Plotted as slightly larger circles at the bottom of the indicator pane, making them easy to distinguish as signals of higher significance.
Flexible HTF Configuration
Customize which higher timeframe to use for analysis based on your current chart timeframe. For example, you can set the indicator to reference the 1-hour chart as the HTF when you are on the 5-minute chart, and the Daily chart as the HTF when you are on the 1-hour chart.
Intuitive Volume Bars
The volume bars are color-coded to show whether volume is increasing (bullish color) or decreasing (bearish color) compared to the previous bar, offering a quick visual gauge of market momentum.
Full Customization
Easily toggle the visibility of CTF and HTF signals and customize the colors for bullish and bearish pivots to match your charting preferences.
Volumatic Support/Resistance Levels [BigBeluga]🔵 OVERVIEW
A smart volume-powered tool for identifying key support and resistance zones—enhanced with real-time volume histogram fills and high-volume markers.
Volumatic Support/Resistance Levels detects structural levels from swing highs and lows, and wraps them in dynamic histograms that reflect the relative volume strength around those zones. It highlights the strongest price levels not just by structure—but by the weight of market participation.
🔵 CONCEPTS
Price Zones: Support and resistance levels are drawn from recent price pivots, while volume is used to visually enhance these zones with filled histograms and highlight moments of peak activity using markers.
Histogram Fill = Activity Zone: The width and intensity of each filled zone adjusts to recent volume bursts.
High-Volume Alerts: Circle markers highlight moments of volume dominance directly on the levels—revealing pressure points of support/resistance.
Clean Visual Encoding: Red = resistance zones, green = support zones, orange = high-volume bars.
🔵 FEATURES
Detects pivot-based resistance (highs) and support (lows) using a customizable range length.
Wraps these levels in volume-weighted bands that expand/contract based on percentile volume.
Color fill intensity increases with rising volume pressure, creating a live histogram feel.
When volume > user-defined threshold , the indicator adds circle markers at the top and bottom of that price level zone.
Bar coloring highlights the candles that generated this high-volume behavior (orange by default).
Adjustable settings for all thresholds and colors, so traders can dial in volume sensitivity.
🔵 HOW TO USE
Identify volume-confirmed resistance and support zones for potential reversal or breakout setups.
Focus on levels with intense histogram fill and circle markers —they indicate strong participation.
Use bar coloring to track when key activity started and align it with broader market context.
Works well in combination with order blocks, trend indicators, or liquidity zones.
Ideal for day traders, scalpers, and volume-sensitive setups.
🔵 CONCLUSION
Volumatic Support/Resistance Levels elevates traditional support and resistance logic by anchoring it in volume context. Instead of relying solely on price action, it gives traders insight into where real conviction lies—by mapping how aggressively the market defended or rejected key levels. It's a visual, reactive, and volume-conscious upgrade to your structural toolkit.

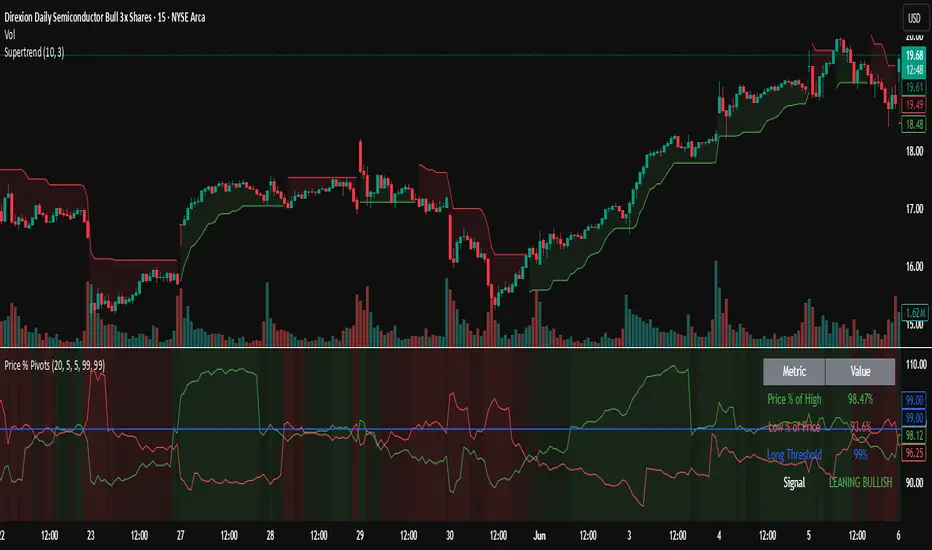
Trending Indicator: Price % of Pivots# Price % of Pivots Indicator
## Overview
A trend-following indicator that measures current price position relative to recent pivot highs and lows as percentages, providing normalized trend analysis across all timeframes and instruments.
## Key Features
- **Real-time trend table** with live signal updates (Strong Bullish/Bearish, Leaning Bullish/Bearish, Neutral)
- **Dual percentage tracking**: Price % of high pivot and low pivot % of current price
- **Universal compatibility** - works on any timeframe and asset class
- **Faster than some other trend indicators** - catches trend changes earlier with less lag
## Trading Signals
- **Bullish bias**: When price % of high pivot > low pivot % of price
- **Bearish bias**: When low pivot % of price > price % of high pivot
- **Customizable thresholds** (default 99%) with alert system
- **Color-coded backgrounds** for immediate visual confirmation
## Configuration
- Adjustable pivot lookback period (5-100 bars)
- Customizable left/right bars for pivot confirmation
- Threshold settings from 50-110% with 0.5% increments
- Full color customization for all elements
## Advantages
- **Speed**: More responsive than traditional ATR-based indicators
- **Clarity**: Clean percentage-based display with professional info table
- **Alerts**: Multiple conditions for automated and manual trading
- **Versatility**: Effective for day trading, swing trading, and multi-timeframe analysis
Perfect for traders seeking a fast, reliable trend indicator that works consistently across all markets and timeframes.
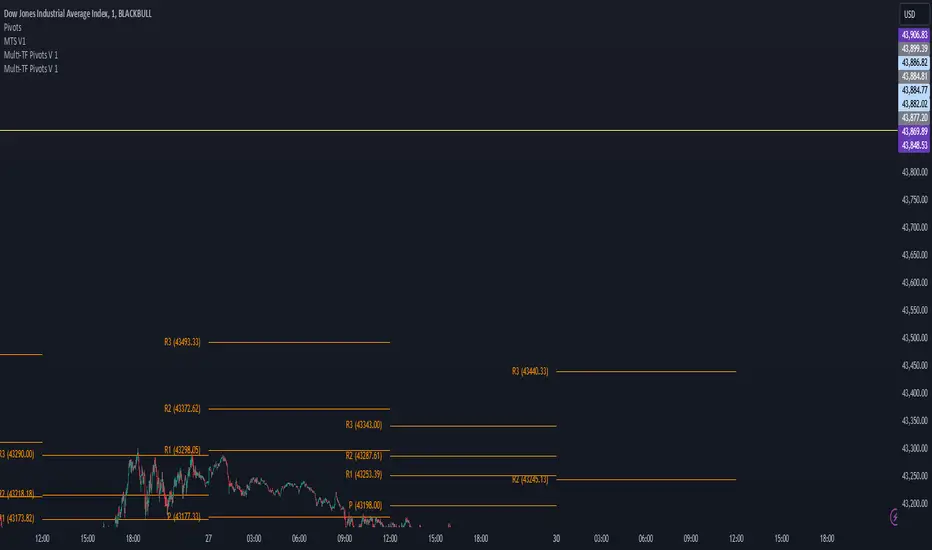
Multi-TF Pivots V1The Multi-TF Pivots Indicator is a powerful and customizable pivot point tool for TradingView. This script allows traders to calculate and display pivot points on a wide range of timeframes, from 1-minute to weekly intervals. It supports both Classic and Fibonacci pivot styles and includes options to customize line colors, label positions, and price visibility. The indicator is ideal for traders who rely on pivot points for intraday and swing trading strategies, offering a clear visual representation of key support and resistance levels. With its flexibility and comprehensive features, this indicator is an essential tool for precise technical analysis.
اندیکاتور Multi-TF Pivots یک ابزار قدرتمند و قابل تنظیم برای محاسبه و نمایش پیوت پوینتها در پلتفرم TradingView است. این اسکریپت به معاملهگران امکان میدهد پیوت پوینتها را در طیف گستردهای از تایمفریمها، از ۱ دقیقه تا هفتگی، محاسبه و نمایش دهند. این اندیکاتور از سبکهای پیوت Classic و Fibonacci پشتیبانی میکند و گزینههایی برای شخصیسازی رنگ خطوط، موقعیت برچسبها و نمایش قیمتها دارد. این ابزار برای معاملهگرانی که به پیوت پوینتها برای استراتژیهای معاملاتی روزانه و نوسانی متکی هستند ایدهآل است و نمایش بصری واضحی از سطوح کلیدی حمایت و مقاومت ارائه میدهد. با انعطافپذیری و ویژگیهای جامع خود، این اندیکاتور یک ابزار ضروری برای تحلیل تکنیکال دقیق است
Statistical RSI Pivot Reversal Indicator [UAlgo]🔶 Idea
The "Statistical RSI Pivot Reversal Indicator " is designed to enhance traditional RSI analysis by incorporating statistical methods to identify potential reversal points more accurately. The core concept is to detect frequently occurring pivot points in the RSI data, which can indicate strong support or resistance levels. By analyzing the most frequent RSI values at these pivots, the script provides traders with clearer signals for potential market reversals, helping to improve the timing of entry and exit points in their trading strategies.
🔶 Key Features
Enhanced RSI Analysis:
This script calculates the Relative Strength Index (RSI) based on user-defined parameters and identifies pivot points in the RSI data. By analyzing these pivots, it detects the most frequently occurring RSI values at support and resistance levels.
Signal Filtering Options:
Filter buy and sell signals based on whether the RSI is in overbought (above 70) or oversold (below 30) conditions, enhancing the reliability of signals.
Visual and Alert Features:
Visual Signals: The script plots the RSI, the most frequent high and low RSI values, and buy/sell signals on the chart.
Alerts: Set up custom alerts for buy and sell conditions, ensuring you never miss a trading opportunity.
🔶 Disclaimer
The "Statistical RSI Pivot Reversal Indicator " script is intended for educational and informational purposes only.
It does not constitute financial advice or investment recommendations.
Trading financial instruments involves risk, and it is possible to lose more than your initial investment. Past performance is not indicative of future results.

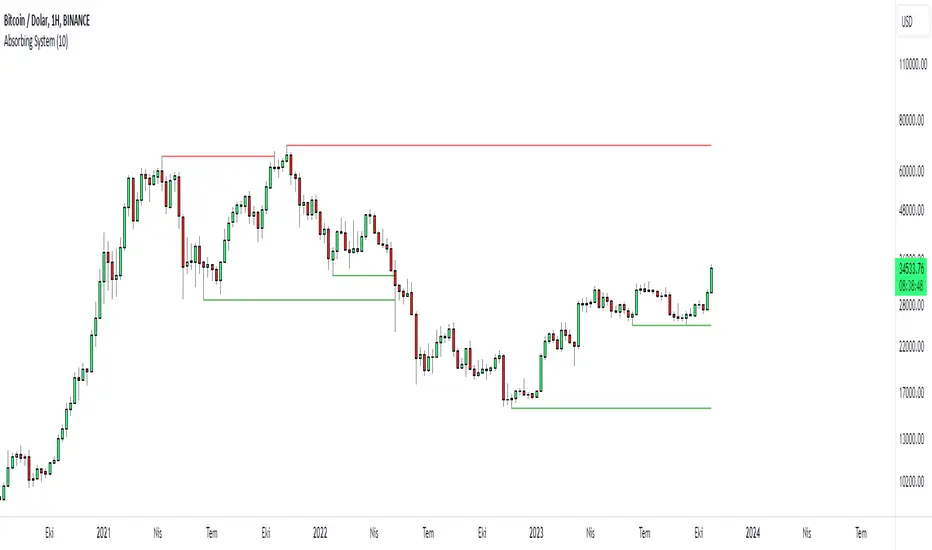
Absorbing System Support and ResistanceHello Traders :)
I am Only Fibonacci.
My purpose in coding this indicator was to detect support and resistance more easily.
What is the working principle of this indicator?
This tool detects pivot points.
If the length of the sell pin is higher than the length of the buy pin, it is considered as resistance.
It detects the formation according to the length of the pivot point and draws a line until this level is broken.
The main purpose is to add a new perspective to support and resistance detection and to prepare an educational code sequence.
The codes are open to everyone, you can develop as you wish.
In the settings you can choose whether you want to see the breakdowns, you can also choose whether the breakdowns will be with the wicks or the body.
func("RES")
func("SUP")
It is written in a functional way.
If you call "RES" inside the func method, it draws the resistors. If you throw a call other than "RES" it draws the supports.
The main concept here;
"RES" = Resistance
"SUP" = Support
Risk Management GO8686: Stop Loss, Position Size & TargetFull Name: Risk Management GO8686: Stop Loss, Position Size & Target
What this indicator provides:
A dashboard to calculate Stop Loss, Position Size and Target, where users can customize Risk Management parameters in the setting.
Position Size: calculated from "initialCapital", "Leverage", "Max Loss", "feeMaker", "feeTaker".
Stop Loss Price: using pivots, default length is set to 3, with an extra ATR value controlled by "'Multiplier OF Extra ATR".
Target: calculated from entry price, risk reward, distance between entry and stop loss, fees
What the indicator does Not provides:
entries of positions: The Long/Short entries displayed are just MACD signal crossing zero, users can apply their own entry logic, by modifying ready2L / ready2S variables.
What the indicator does Not guarantee:
the integrity, timeliness, accuracy, and comprehensiveness of the data, calculation method, calculation results, etc.
Two types labels:
1. Automated labels: they are displayed when MACD signal crossing zero, use "Display History Labels" to toggle display or not.
2. Setup Manually label: located at the right side of the latest bar, to display results when users setup manually
The settings of the indicator:
"Toggle to Reload",
"InitialCapital", "Leverage", "Max Loss % per trade", "feeMaker", "feeTaker",
4 length inputs for Pivot, "Multiplier of Extra ATR for stop loss",
"Toggle To setup manually", "Toggle between Long / Short", "Entry Price, set manually", "Stop Loss Price, set manually", "Risk-Reward Ratio"
"Display History Labels"
---------- Disclaimer ----------
Before using or requesting access to the indicator, customers/users acknowledge that they have read and accepted that the indicator, any associated contents on all social medias and any communication with the indicator author, including but not limited to: product and service details, signals, alerts, data, calculation methods, calculation results, user manual, tutorials, ideas, videos, chats, messages, emails, blogs, tweets, etc. are provided solely for educational purpose and Not as financial advice. Customers/users understand and agree to use the aforementioned indicator and information at their own risk.
---------- Updates ----------
The latest updates override the previous content.
To activate a update, if it does not load as expected: close the indicator, save the chart, clear browser caches, restart the browser, reload the chart and apply the indicator to the chart.

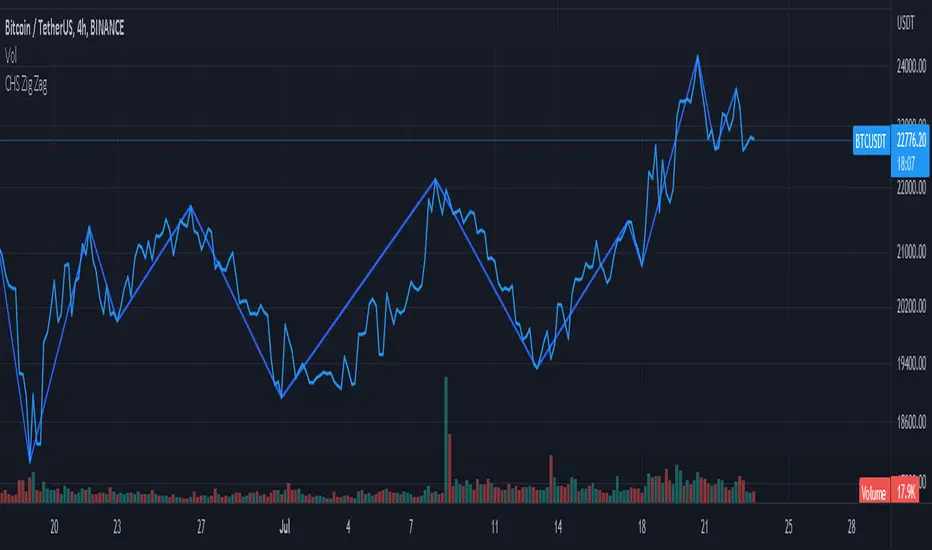
CHS Zig ZagCHS ZigZag stands for Changeable Source ZigZag
The original ZigZag indicator offered by TradingView doesn't have the ability to measure the tips and troughs based on closing prices (line chart), however, this indicator is capable of receiving an input from user that determines the price source used for further calculations.
The default inputs of the original ZigZag indicator have been also changed in order to make it adapt to pivots formed on line chart but users can change arbitrarily.
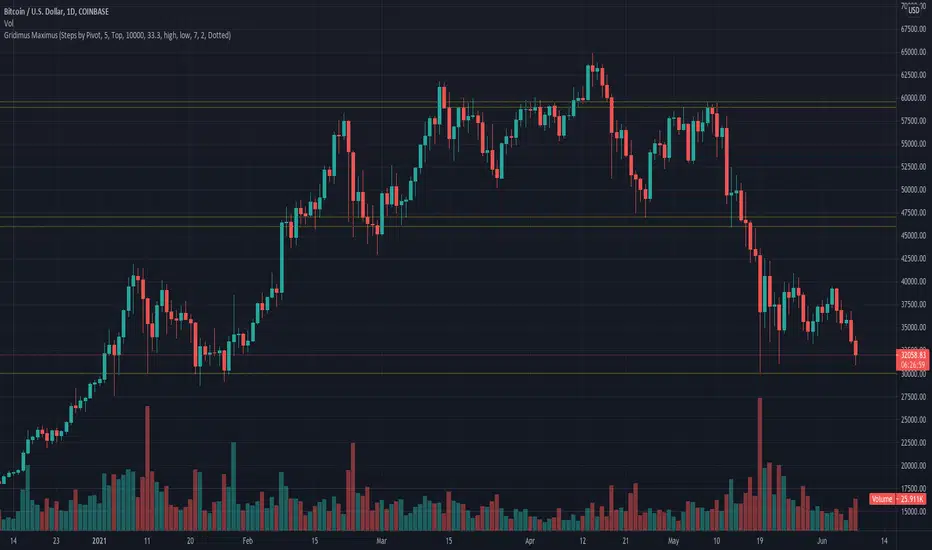
Gridimus MaximusGridimus Maximus draws N grid lines stepping by price or percent in chosen direction from set price, or draws N grid lines stepping by pivots.
The queue function method used is adapted from an example provided on the PineCoders website, much gratitude to LucF for this gem!
To prevent grid lines out of range from causing chart to rescale right click on chart's price column and enable Scale Price Chart Only.
Pictured example above is using Type Of Increment: Steps By Pivot, Number Of Steps: 5.
Pictured example below is using Type Of Increment: Steps By Price, Number Of Steps: 6, Starts From Price: $10k, Steps By Percent Or Price: $10k.
Pictured example below is using Type Of Increment: Steps By Percent, Number Of Steps: 7, Starts From Price: $10k, Steps By Percent Or Price: 33%.
NOTICE: This is an example script and not meant to be used as an actual strategy. By using this script or any portion thereof, you acknowledge that you have read and understood that this is for research purposes only and I am not responsible for any financial losses you may incur by using this script!
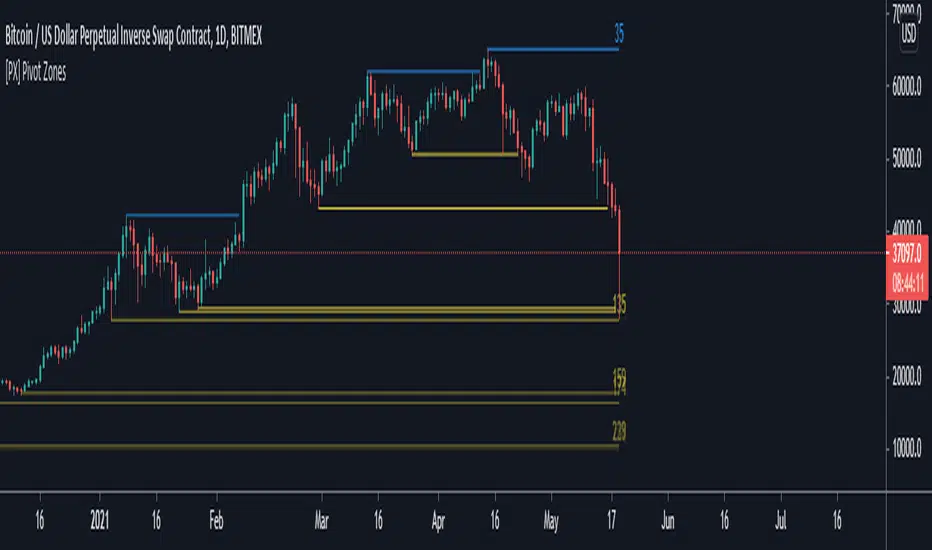
[PX] Pivot ZonesHello everyone,
I was having some fun with the new gradient function, arrays and pivots. Decided that i would publish my little playground :)
This script basically draws lines or zones for detected pivot high and lows and counts the number of candles those levels have been untested.
Tested levels will stop at the candle, which breaks them.
How does it work?
- Define the number of candles that make up the pivot point with the "Pivot Left" and "Pivot Right" parameter (I took more extreme values to showcase the indicator).
- Select your "Layout Type": This can be either a line at the pivot point, a zone between the pivot point and its body or the average of the two.
- You can in-/decrease the number of lines with the "Number of Lines/Zones" parameter.
The older a line becomes the more it will lose of its original transparency.
Hope that might be useful to some of you :)
Please click the "Like"-button and follow me for future open-source script publications.
If you are looking for help with your custom PineScript development, don't hesitate to contact me directly here on Tradingview or through the link in my signature :)
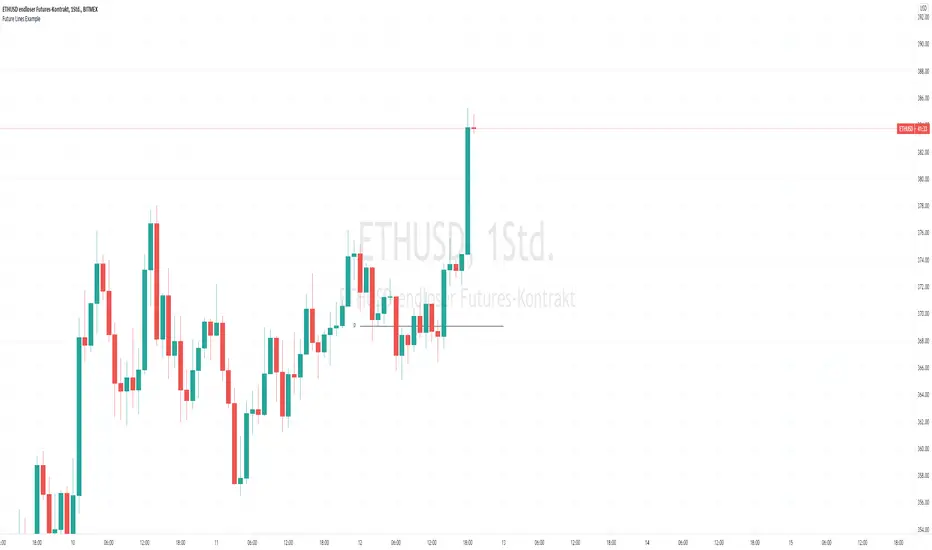
Future Line Example for study PivotPoint I know a lot of people who want to draw a line in future. I asked a lot of good Guys in Pine and they havent a solution. But today i got an idea i want to share with you. I hope this example give you a hint.
it is Usefull if you want to draw it like the Orginal Pivot Point standart or everything else.
I see a lot of Pivot Indicators but all stop at the actual Candle or extended right 100+ Years
Have Fun :)
Colored PivotColored Pivot Level.
This displays the daily Pivot Level and fills the background color between the price and the pivot. In green or red, if the price is above or below the pivot.
I use it on higer time frames (H1, M15, ..) for trade the trends on lower ones.

Expanded Floor PivotsHello Everyone,
The Expanded Floor Pivots is introduced in the book "Secrets of a Pivot Boss: Revealing Proven Methods for Profiting in the Market " by Franklin Ochoa. He added four new levels: S4, R4, BC and TC. There are many great ideas in the book, such using these levels, following trend, time price opportunity and much more. (Thanks to @tonyjab for pushing me to read this book)
The definition/formula of the levels defined in the book:
r1 = 2 * pivot - Low
r2 = pivot + (High - Low)
r3 = r1 + (High - Low)
r4 = r3 + (r2 - r1)
tc = (pivot - bc) + pivot
pivot = (High + Low + Close) / 3
bc = (High + Low) / 2
s1 = 2 * pivot - High
s2 = pivot - (High - Low)
s3 = s1 - (High - Low)
s4 = s3 - (s1 - s2)
The area between TC and BC is used as Pivot Channel, (blue area in the chart). you can see how it helps on identifying the trend.
Options:
By default the script decides Higher Time Frame but if you want you can set HTF as you wish.
You can choose line style as: Solid, Circles or Cross
and also you have option to show only last period or all historical levels.
Enjoy!

Trend LinesHello Everyone! This is my new trend lines script (after beta version that was published almost one year ago)
The idea is to find Pivot Highs (PH) and Pivot Lows(PL) first.
Then, If current PH is smaller then previous PH (means no new higher high and possible downtrend) then draw trend line using them. and also it checks previous trend line (if exits) and if current angle is smaller then don't extend previous one.
Same idea when using Pivot Lows, If current PL is higher then previous PL (means no new lower low and possible uptrend) then draw trend line using them. and also it checks previous trend line (if exits) and if current angle is smaller then don't extend previous one.
Optionally style of old trend lines drawn as dashed.
Hope you enjoy it!

HH HL LH LL + BOS / CHoCHHH HL LH LL + BOS / CHoCH Structure Indicator (ATR Adaptive)
This indicator provides a complete market structure framework using swing-based pivots, real-time trend detection, BOS (Break of Structure), CHoCH (Change of Character), and optional ATR-adaptive swing sensitivity.
🔹 Core Features
1. Market Structure Labels
The script detects and labels:
HH – Higher High
LH – Lower High
HL – Higher Low
LL – Lower Low
These labels help visualize trend continuation or weakness in structure.
Each label type can be individually toggled ON/OFF in settings.
2. ATR-Based Adaptive Swing Length (Optional)
Swing pivots can be calculated using:
A fixed manual swing length, or
A dynamic ATR-based swing length that adjusts automatically to volatility.
Increasing volatility → longer swings
Decreasing volatility → tighter swings
This makes structure detection more stable and timeframe-adaptive.
3. Close-Based Break of Structure (BOS)
The indicator identifies a BOS when:
Price closes above the previous swing high (Bullish BOS↑)
Price closes below the previous swing low (Bearish BOS↓)
BOS labels can be turned ON/OFF without affecting internal calculations.
4. CHoCH (Change of Character)
CHoCH is triggered when a BOS occurs against the current trend, indicating a potential trend reversal:
CHoCH↑ – Bearish → Bullish reversal
CHoCH↓ – Bullish → Bearish reversal
CHoCH remains active even when BOS labels are turned off.
5. Alerts
The indicator provides alert conditions for:
CHoCH↑ (Bullish Trend Shift)
CHoCH↓ (Bearish Trend Shift)
This allows traders to automate notifications for significant trend changes.
6. Trend State Tracking
The script internally tracks the current structure-based trend:
Uptrend
Downtrend
Undefined
The trend updates dynamically based on real BOS events.
7. Fully Backwards Compatible
The indicator generates structure, BOS, and CHoCH even when scrolling back deep in chart history, thanks to extended max_bars_back handling.
Summary
This tool provides a complete, flexible, and non-repainting framework for market structure analysis, suitable for:
SMC/ICT traders
Swing & intraday traders
Trend traders
Price action analysts
With adaptive swing detection, clean structure labeling, BOS/CHoCH logic, and alert integration, the indicator helps traders understand market transitions with clarity and precision.

HL/LH Confirmation Strategy (Clean Market Structure)🚦 HL/LH Confirmation Strategy (Clean Market Structure)
This indicator is specifically designed to help traders identify a clean market structure by tracking the formation of Higher Lows (HL) and Lower Highs (LH). Rather than chasing new price extremes (new Highs or new Lows), the focus is on waiting for trend strength confirmation before considering an entry.
Key Strategy: Waiting for Trend Confirmation 💡
The core advantage of this indicator lies in its confirmation strategy:
For Uptrends (Bullish): The indicator doesn't signal just any low, but only when it detects a Higher Low (HL)—a low that is higher than the previous low. This is a crucial sign that the market has defended a level and is ready to continue moving up. This approach helps avoid chasing new lows and encourages entering trades after confirmation.
For Downtrends (Bearish): Similarly, the indicator looks for the formation of a Lower High (LH)—a high that is lower than the previous high. This suggests that buyers failed to breach the last resistance, signaling a potential continuation of the downside movement.
The indicator alternates between looking for an HL, then an LH, then an HL, visually mapping the Pivot swings and highlighting the moment of trend confirmation for potential trade entries.
Indicator Features ✨
Clear Structure Display: By drawing connecting lines between valid HL and LH points, the indicator visually maps the current market structure.
Pivot Detection: It uses an effective method for Pivot detection, with the sensitivity adjustable via the "Pivot Left" and "Pivot Right" parameters.
Custom Label Placement (Crucial Detail):
HL Label: Placed below the candle for better visual clarity of the bullish support area.
LH Label: Placed above the candle for better visual clarity of the bearish resistance area.
Customizable Colors: Full control over the background and text colors for HL and LH signals, as well as the thickness and color of the connecting lines between Pivot points.
⚙️ Input Parameters
Pivot Settings
Pivot Left / Pivot Right: Determine the number of bars to the left and right that must have lower/higher prices for a point to be declared a valid Pivot (Pivot High or Pivot Low). Increase these values to detect more significant, longer-term swings.
Signal Colors
HL Background/Text Color: Colors for the background and text of the Higher Low (HL) labels.
LH Background/Text Color: Colors for the background and text of the Lower High (LH) labels.
Line Settings
Line Color / Line Width: Allows customization of the appearance of the line connecting the detected HL and LH points.
Recommended Use
This indicator is ideal for traders practicing Price Action and strategies based on Market Structure. Use the HL signals as potential zones for long entries (buying) in an uptrend, and LH signals as zones for short entries (selling) in a downtrend, always after the point formation is confirmed.
