Multi Timeframe Market Structure ContinuationOverview
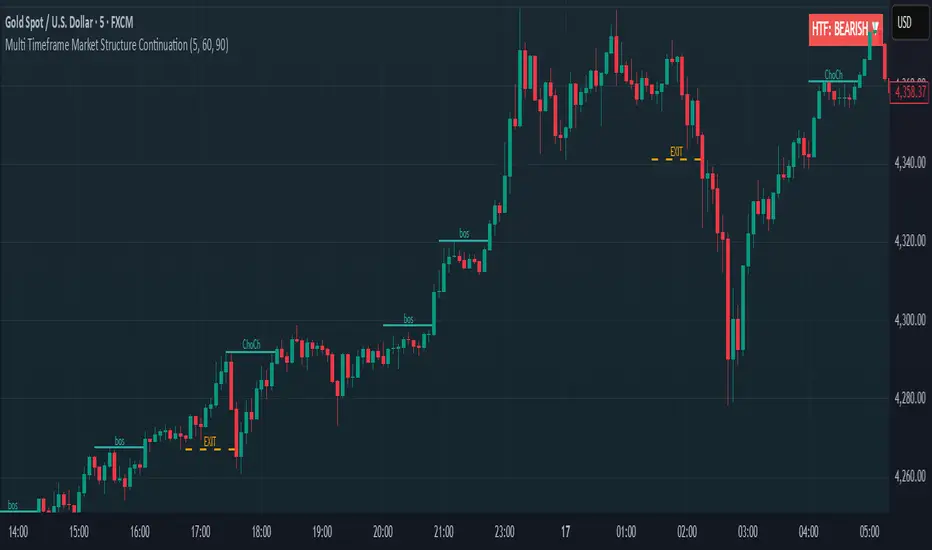
This indicator identifies Break of Structure (BOS) and Change of Character (ChoCh) patterns using multi-timeframe (MTF) analysis to filter high-probability trade setups. By aligning lower timeframe signals with higher timeframe bias, it helps traders enter positions in the direction of the dominant trend while avoiding counter-trend traps.
Multi-Timeframe Analysis
The indicator analyzes market structure on two timeframes simultaneously:
Current Timeframe (CTF): Detects immediate BOS and ChoCh signals for entry timing
Higher Timeframe (HTF): Establishes the overall trend direction (default: 1H, customizable)
Signals only appear when the current timeframe structure aligns with the higher timeframe bias, ensuring you're trading with the momentum, not against it.
Break of Structure (BOS)
BOS signals indicate trend continuation - when price breaks a previous high in an uptrend or a previous low in a downtrend. These are reliable entries that confirm the trend is still active and strong.
Change of Character (ChoCh)
ChoCh signals mark early trend reversals - when market structure shifts from bearish to bullish (or vice versa). When captured in alignment with the higher timeframe trend, ChoCh entries can achieve exceptional risk-to-reward ratios as they allow entry near the beginning of a new impulse move.
Exit Signals
Exit signals are plotted when a ChoCh occurs in the opposite direction of the HTF trend. For example, if the HTF is bullish and a bearish ChoCh forms on the current timeframe, an orange "EXIT" signal appears - warning long traders that the lower timeframe structure is shifting against them. This provides an early warning system to protect profits or minimize losses before the HTF trend itself reverses.
Trading Strategy Recommendations
Trending Markets (Recommended)
In strong trending conditions, both BOS and ChoCh signals can be taken when aligned with the HTF bias. ChoCh entries are particularly powerful as they catch early reversals within the larger trend, offering entries with tight stop losses and extended profit targets.
Ranging Markets
During consolidation or choppy conditions, it's best to be selective and take only BOS entries. BOS signals confirm that the trend is continuing beyond the range, reducing false breakouts and whipsaw trades that are common with counter-trend ChoCh signals in sideways markets.
Customization
Pivot Length: Adjust the sensitivity of structure detection (default: 5). Lower values detect structure more frequently with earlier but potentially noisier signals. Higher values provide cleaner, more significant structural breaks but with some delay.
Higher Timeframe: Customize the HTF to suit your trading style. Day traders might use 1H HTF on 5m charts, while swing traders could use 4H or Daily HTF.
Alert System
Six alert conditions available:
Long BOS Entry / Long ChoCh Entry
Short BOS Entry / Short ChoCh Entry
Long Exit / Short Exit
All alerts fire only on confirmed candle closes to eliminate repainting and false signals.
Visual Features
Color-coded background showing HTF bias
Clear BOS/ChoCh labels with horizontal lines at structure levels
Orange "EXIT" signals when structure breaks against your position
Gray lines tracking current swing highs/lows
HTF trend indicator in the top-right corner
"pivot"に関するスクリプトを検索
Institutional Levels (CNN) - [PhenLabs]📊Institutional Levels (Convolutional Neural Network-inspired)
Version : PineScript™v6
📌Description
The CNN-IL Institutional Levels indicator represents a breakthrough in automated zone detection technology, combining convolutional neural network principles with advanced statistical modeling. This sophisticated tool identifies high-probability institutional trading zones by analyzing pivot patterns, volume dynamics, and price behavior using machine learning algorithms.
The indicator employs a proprietary 9-factor logistic regression model that calculates real-time reaction probabilities for each detected zone. By incorporating CNN-inspired filtering techniques and dynamic zone management, it provides traders with unprecedented accuracy in identifying where institutional money is likely to react to price action.
🚀Points of Innovation
● CNN-Inspired Pivot Analysis - Advanced binning system using convolutional neural network principles for superior pattern recognition
● Real-Time Probability Engine - Live reaction probability calculations using 9-factor logistic regression model
● Dynamic Zone Intelligence - Automatic zone merging using Intersection over Union (IoU) algorithms
● Volume-Weighted Scoring - Time-of-day volume Z-score analysis for enhanced zone strength assessment
● Adaptive Decay System - Intelligent zone lifecycle management based on touch frequency and recency
● Multi-Filter Architecture - Optional gradient, smoothing, and Difference of Gaussians (DoG) convolution filters
🔧Core Components
● Pivot Detection Engine - Advanced pivot identification with configurable left/right bars and ATR-normalized strength calculations
● Neural Network Binning - Price level clustering using CNN-inspired algorithms with ATR-based bin sizing
● Logistic Regression Model - 9-factor probability calculation including distance, width, volume, VWAP deviation, and trend analysis
● Zone Management System - Intelligent creation, merging, and decay algorithms for optimal zone lifecycle control
● Visualization Layer - Dynamic line drawing with opacity-based scoring and optional zone fills
🔥Key Features
● High-Probability Zone Detection - Automatically identifies institutional levels with reaction probabilities above configurable thresholds
● Real-Time Probability Scoring - Live calculation of zone reaction likelihood using advanced statistical modeling
● Session-Aware Analysis - Optional filtering to specific trading sessions for enhanced accuracy during active market hours
● Customizable Parameters - Full control over lookback periods, zone sensitivity, merge thresholds, and probability models
● Performance Optimized - Efficient processing with controlled update frequencies and pivot processing limits
● Non-Repainting Mode - Strict mode available for backtesting accuracy and live trading reliability
🎨Visualization
● Dynamic Zone Lines - Color-coded support and resistance levels with opacity reflecting zone strength and confidence scores
● Probability Labels - Real-time display of reaction probabilities, touch counts, and historical hit rates for active zones
● Zone Fills - Optional semi-transparent zone highlighting for enhanced visual clarity and immediate pattern recognition
● Adaptive Styling - Automatic color and opacity adjustments based on zone scoring and statistical significance
📖Usage Guidelines
● Lookback Bars - Default 500, Range 100-1000, Controls the historical data window for pivot analysis and zone calculation
● Pivot Left/Right - Default 3, Range 1-10, Defines the pivot detection sensitivity and confirmation requirements
● Bin Size ATR units - Default 0.25, Range 0.1-2.0, Controls price level clustering granularity for zone creation
● Base Zone Half-Width ATR units - Default 0.25, Range 0.1-1.0, Sets the minimum zone width in ATR units for institutional level boundaries
● Zone Merge IoU Threshold - Default 0.5, Range 0.1-0.9, Intersection over Union threshold for automatic zone merging algorithms
● Max Active Zones - Default 5, Range 3-20, Maximum number of zones displayed simultaneously to prevent chart clutter
● Probability Threshold for Labels - Default 0.6, Range 0.3-0.9, Minimum reaction probability required for zone label display and alerts
● Distance Weight w1 - Controls influence of price distance from zone center on reaction probability
● Width Weight w2 - Adjusts impact of zone width on probability calculations
● Volume Weight w3 - Modifies volume Z-score influence on zone strength assessment
● VWAP Weight w4 - Controls VWAP deviation impact on institutional level significance
● Touch Count Weight w5 - Adjusts influence of historical zone interactions on probability scoring
● Hit Rate Weight w6 - Controls prior success rate impact on future reaction likelihood predictions
● Wick Penetration Weight w7 - Modifies wick penetration analysis influence on probability calculations
● Trend Weight w8 - Adjusts trend context impact using ADX analysis for directional bias assessment
✅Best Use Cases
● Swing Trading Entries - Enter positions at high-probability institutional zones with 60%+ reaction scores
● Scalping Opportunities - Quick entries and exits around frequently tested institutional levels
● Risk Management - Use zones as dynamic stop-loss and take-profit levels based on institutional behavior
● Market Structure Analysis - Identify key institutional levels that define current market structure and sentiment
● Confluence Trading - Combine with other technical indicators for high-probability trade setups
● Session-Based Strategies - Focus analysis during high-volume sessions for maximum effectiveness
⚠️Limitations
● Historical Pattern Dependency - Algorithm effectiveness relies on historical patterns that may not repeat in changing market conditions
● Computational Intensity - Complex calculations may impact chart performance on lower-end devices or with multiple indicators
● Probability Estimates - Reaction probabilities are statistical estimates and do not guarantee actual market outcomes
● Session Sensitivity - Performance may vary significantly between different market sessions and volatility regimes
● Parameter Sensitivity - Results can be highly dependent on input parameters requiring optimization for different instruments
💡What Makes This Unique
● CNN Architecture - First indicator to apply convolutional neural network principles to institutional-level detection
● Real-Time ML Scoring - Live machine learning probability calculations for each zone interaction
● Advanced Zone Management - Sophisticated algorithms for zone lifecycle management and automatic optimization
● Statistical Rigor - Comprehensive 9-factor logistic regression model with extensive backtesting validation
● Performance Optimization - Efficient processing algorithms designed for real-time trading applications
🔬How It Works
● Multi-timeframe pivot identification - Uses configurable sensitivity parameters for advanced pivot detection
● ATR-normalized strength calculations - Standardizes pivot significance across different volatility regimes
● Volume Z-score integration - Enhanced pivot weighting based on time-of-day volume patterns
● Price level clustering - Neural network binning algorithms with ATR-based sizing for zone creation
● Recency decay applications - Weights recent pivots more heavily than historical data for relevance
● Statistical filtering - Eliminates low-significance price levels and reduces market noise
● Dynamic zone generation - Creates zones from statistically significant pivot clusters with minimum support thresholds
● IoU-based merging algorithms - Combines overlapping zones while maintaining accuracy using Intersection over Union
● Adaptive decay systems - Automatic removal of outdated or low-performing zones for optimal performance
● 9-factor logistic regression - Incorporates distance, width, volume, VWAP, touch history, and trend analysis
● Real-time scoring updates - Zone interaction calculations with configurable threshold filtering
● Optional CNN filters - Gradient detection, smoothing, and Difference of Gaussians processing for enhanced accuracy
💡Note
This indicator represents advanced quantitative analysis and should be used by traders familiar with statistical modeling concepts. The probability scores are mathematical estimates based on historical patterns and should be combined with proper risk management and additional technical analysis for optimal trading decisions.

Chartlense Dashboard (Data, Trend & Levels)Chartlense Dashboard (Data, Trend & Levels)
Overview
This dashboard is designed to solve two common problems for traders: chart clutter and the manual drawing of support and resistance levels . It consolidates critical data from multiple indicators into a clean table overlay and automatically plots the most relevant S&R levels based on recent price action. The primary goal is to provide a clear, at-a-glance overview of the market's structure and data.
It offers both a vertical and horizontal layout to fit any trader's workspace.
Key Concepts & Calculations Explained
This indicator is more than a simple collection of values; it synthesizes data to provide unique insights. Here’s a conceptual look at how its core components work:
Automatic Support & Resistance (Pivot-Based):
The dashed support (green) and resistance (red) lines are not manually drawn. They are dynamically calculated based on the most recent confirmed pivot highs and pivot lows . A pivot is a foundational concept in technical analysis that identifies potential turning points in price action.
How it works: A pivot high is a candle whose `high` is higher than a specific number of candles to its left and right (the "Pivot Lookback" is set to 5 by default in the settings). A pivot low is the inverse. By automatically identifying these confirmed structural points, the script visualizes the most relevant levels of potential supply and demand on the chart.
Relative Volume (RVOL):
This value in the table is not the standard volume. It measures the current bar's volume against its recent average (specifically, `current volume / 10-period simple moving average of volume`).
Interpretation: A reading above 2.0 (indicated by green text) suggests that the current volume is more than double the recent average. This technique is used to identify significant volume spikes, which can add conviction to breakouts or signal potential market climaxes.
Consolidated Data for Context:
Other values displayed in the table, such as the EMAs (9, 20, 200) , Bollinger Bands (20, 2) , RSI (14) , MACD (12, 26, 9) , and VWAP (on intraday charts), use their standard industry calculations. They are included to provide a complete contextual picture without needing to load each indicator separately, saving valuable chart space.
How to Use This in Your Trading
This dashboard is designed as a tool for confluence and context , not as a standalone signal generator. Here are some ways to integrate it into your analysis workflow:
As a Trend Filter: Before considering a trade, quickly glance at the EMAs and the MACD values in the table. A price above the key EMAs and a positive MACD can serve as a quick confirmation that you are aligned with the dominant trend.
To Validate Breakouts: When the price is approaching a key Resistance level (red pivot line), watch the RVOL value . A reading above 2.0 on the breakout candle adds significant confirmation that the move is backed by strong interest. The same logic applies to breakdowns below a support level.
To Spot Potential Reversals: Confluence is key. For example, if the price is testing a Support level (green pivot line) AND the RSI in the table is approaching oversold levels (e.g., near 30), it can signal a higher probability reversal setup.
About This Indicator
This indicator was developed by the team at ChartLense to help traders declutter their charts and focus on the data that matters. We believe in making complex analysis more accessible and organized. We hope this free tool is a valuable addition to your trading process.

Liquidity Point LinesLiquidity Point Lines
The "Liquidity Point Lines" indicator helps traders identify potential areas of liquidity in the market by drawing lines at specific price levels where significant "liquidation events" may have occurred. These events are determined by analyzing the MACD Histogram and identifying pivot points that suggest strong movements, which are often associated with the flushing out of short or long positions.
How It Works
This indicator leverages the MACD Histogram to gauge the strength of price momentum. It then identifies pivot highs and lows within the MACD Histogram's values. When a significant pivot is detected, the indicator interprets this as a potential "liquidity point" — a price level where a substantial amount of buy or sell orders (often due to liquidations) may have been executed.
The indicator distinguishes between:
Shorts Liquidation Points (Resistance): These are identified when the MACD Histogram registers a pivot high, suggesting a strong upward movement that could have liquidated short positions. Lines are drawn at the high price of the bar where this pivot occurred.
Longs Liquidation Points (Support): Conversely, these are identified when the MACD Histogram registers a pivot low, indicating a strong downward movement that might have liquidated long positions. Lines are drawn at the low price of the bar where this pivot occurred.
Key Features and Settings
The "Liquidity Point Lines" indicator offers extensive customization to tailor its sensitivity and visual representation:
MACD Settings for Liquidity: Configure the underlying MACD calculation with adjustable Fast Length, Slow Length, Source, Signal Smoothing, and MA Types (SMA/EMA) for both the Oscillator and Signal Line.
Liquidity Points Settings:
Pivot Lookback Left/Right: Define the number of bars to look back on either side to identify a pivot in the MACD Histogram.
Dynamic Strength Thresholds: This powerful feature allows the indicator to dynamically calculate the significance of a liquidation event. When enabled, it uses the average absolute histogram value over a specified Dynamic Threshold Lookback Period and applies Small and Medium Threshold Factors to determine the strength (Small, Medium, or Large) of the liquidity point.
Fixed Strength Thresholds: If dynamic thresholds are disabled, you can set fixed numerical values for Small and Medium Histogram Thresholds to define the strength categories.
Color & Style Customization: Assign distinct colors for Small, Medium, and Large liquidation points, choose the Line Style (Solid, Dashed, Dotted), and set the Label Text Color.
Label X Offset (To Right): Adjust the horizontal position of the liquidity point labels on your chart.
Liquidity Points Management:
Max Active Liquidity Lines: Control the maximum number of liquidity lines displayed simultaneously on your chart. Older lines are automatically removed to maintain clarity, except for lines that have been "touched" (i.e., price has interacted with that liquidity level).
Visual Interpretation
Each liquidity line is colored according to the strength of the detected liquidation event, making it easy to visually assess the potential significance of the price level. Lines extend to the right, serving as ongoing reference points. When the price interacts with a liquidity line (i.e., "touches" it), the line and its corresponding label are removed, indicating that the liquidity at that level may have been absorbed.
This indicator can be a valuable tool for identifying potential support and resistance levels, understanding market reactions to "liquidation cascades," and informing your trading decisions.

IU Pivot Zones + GMADESCRIPTION:
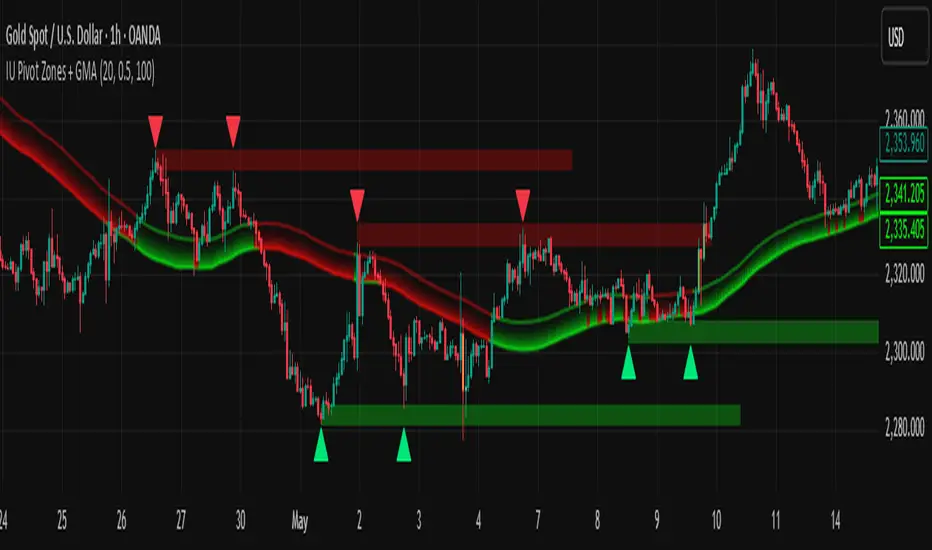
IU Pivot Zones + GMA is a smart price-action-based indicator that detects meaningful support and resistance zones formed through pivot highs/lows while combining them with dynamic zone generation and Geometric Moving Averages (GMA). This tool is built to help traders visualize institutional breakout/rejection zones with clear, logical mapping and live box management — helping you stay ahead of the move.
The indicator is designed for intraday, swing, and positional traders who want to enhance their trading decisions with visual confluence zones and market structure logic.
USER INPUTS
* Pivot point Lengths: Number of bars used to detect pivot highs/lows
* Zone length: Controls the thickness of the support/resistance zone; higher values create wider zones
* GMA Length: Period for calculating the geometric moving averages based on highs and lows
* Allow Bar/candle Color: Enables or disables special candle coloring when price interacts with the zones
LOGIC OF THE INDICATOR:
* Detects pivot highs and pivot lows using the user-defined length
* Compares consecutive pivot levels to determine if they fall within a valid ATR-based price band to form a zone
* If confirmed, the indicator dynamically plots a resistance or support box between those pivot points, colored respectively (red for resistance, green for support)
* The boxes update in real-time based on price action. If price respects the zone, the box extends forward. If price breaks the zone, the box disappears
* Geometric Moving Averages (GMA) based on logarithmic mean of highs and lows are plotted to offer a trend bias
* Candles that touch the top of the support zone are colored yellow, and those touching the bottom of the resistance zone are orange, enhancing zone reaction visibility
WHY IT IS UNIQUE:
* Uses logarithmic-based GMAs, which are smoother and less reactive than traditional moving averages
* ATR-based zone logic makes it adaptive to volatility instead of using fixed-width zones
* Combines structural levels (pivots), volatility filters (ATR), and trend overlays (GMA) in one unified tool
* Real-time zone extension and disappearance logic based on price interaction
HOW USER CAN BENEFIT FROM IT:
* Spot high-probability breakout or reversal zones that price respects consistently
* Use the GMA cloud for trend confirmation — for example, bullish bias when price is above both GMAs
* Build price action strategies around zone touches, breakouts, or rejections
* Use color-coded candles as real-time alerts for potential entry/exit signals near S/R levels
* Save time by avoiding manual marking of zones on charts across timeframes
DISCLAIMER:
This indicator is created for educational and informational purposes only. It does not constitute financial advice or a recommendation to buy or sell any asset. All trading involves risk, and users should conduct their own analysis or consult with a qualified financial advisor before making any trading decisions. The creator is not responsible for any losses incurred through the use of this tool. Use at your own discretion.
Rocky's Dynamic DikFat Supply & Demand ZonesDynamic Supply & Demand Zones
Overview
The Dynamic Supply & Demand Zones indicator identifies key supply and demand levels on your chart by detecting pivot highs and lows. It draws customizable boxes around these zones, helping traders visualize areas where price may react. With flexible display options and dynamic box behavior, this tool is designed to assist in identifying potential support and resistance levels for various trading strategies.
Key Features
Pivot-Based Zones: Automatically detects supply (resistance) and demand (support) zones using pivot highs and lows on the chart’s timeframe.
Dynamic Box Sizing: Boxes shrink when price enters them, reflecting reduced zone strength, and stop adjusting once price fully crosses through.
Customizable Display: Choose to show current-day boxes, historical boxes, or all boxes, with an option to update past box colors dynamically.
Session-Based Extension: Boxes can extend to the current bar or stop at 4:00 PM of the creation day’s 9:30 AM–4:00 PM trading session (ideal for stock markets).
Color Coding: Borders change color based on price position:
Green for demand zones (price above the box).
Red for supply zones (price below the box).
White for neutral zones (price inside the box).
User-Friendly Inputs: Adjust pivot lookback periods, box visibility, extension behavior, and colors via intuitive input settings.
How It Works
Zone Detection: The indicator uses pivot highs and lows to define supply and demand zones, plotting boxes between these levels.
Box Behavior:
Boxes are created when pivot highs and lows are confirmed, with no overlap with the previous box.
When price enters a box, it shrinks to reflect interaction, stopping once price exits completely.
Boxes can extend to the current bar or end at 4:00 PM of the creation day (or next trading day if created after 4:00 PM or on weekends).
Display Options:
Current Only: Shows boxes created on the current day.
Historical Only: Shows boxes from previous days, with optional color updates.
All Boxes: Shows all boxes, with an option to hide historical box color updates.
Performance: Limits the number of boxes to 200 to ensure smooth performance, removing older boxes as needed.
Inputs
Pivot Look Right/Left: Set the number of bars (default: 2) to confirm pivot highs and lows.
What Boxes to Show: Select Current Only, Historical Only, or All Boxes (default: Current Only).
Boxes On/Off: Toggle box visibility (default: on).
Extend Boxes to Current Bar: Choose whether boxes extend to the current bar or stop at 4:00 PM (default: off, stops at 4:00 PM).
Update Past Box Colors: Enable/disable color updates for historical boxes (default: on).
Demand/Supply/Neutral Box Color: Customize border colors (default: green, red, white).
How to Use
Add the indicator to your chart.
Adjust inputs to match your trading style (e.g., pivot lookback, box extension, colors).
Use the boxes to identify potential support (demand) and resistance (supply) zones:
Green-bordered boxes (price above) may act as support.
Red-bordered boxes (price below) may act as resistance.
White-bordered boxes (price inside) indicate active price interaction.
Combine with other analysis tools (e.g., trendlines, indicators) to confirm trade setups.
Monitor box shrinking to gauge zone strength and watch for breakouts when price fully crosses a box.
Understanding Supply and Demand in Stock Trading
In stock trading, supply and demand are fundamental forces driving price movements. Demand refers to the willingness of buyers to purchase a stock at a given price, often creating support levels where buying interest prevents further price declines. Supply represents the willingness of sellers to offload a stock, forming resistance levels where selling pressure halts price increases. These zones are critical because they highlight areas where significant buying or selling activity has occurred, influencing future price behavior.
The importance of supply and demand lies in their ability to reveal where institutional traders, with large orders, have entered or exited the market. Demand zones, often seen at pivot lows, indicate strong buying interest and potential areas for price reversals or bounces. Supply zones, typically at pivot highs, signal heavy selling and possible reversal points for downward moves. By identifying these zones, traders can anticipate where price is likely to stall, reverse, or break out, enabling better entry and exit decisions. This indicator visualizes these zones as dynamic boxes, making it easier to spot high-probability trading opportunities while emphasizing the core market dynamics of supply and demand.
Feedback
This indicator is designed to help traders visualize supply and demand zones effectively. If you have suggestions for improvements, please share your feedback in the comments!
Non-Psychological Levels🟩 Non-Psychological Levels is a structural analysis tool that segments price action into objective ranges, identifying Broken and Unbroken levels without relying on psychological or time-based assumptions. By emphasizing mechanically derived price behavior, it provides traders with a clear framework for analyzing support and resistance in a consistent and unbiased manner across various market conditions.
This indicator introduces a new approach to understanding market structure by focusing on price movement within defined segments, free from behavioral patterns, round numbers, or specific time intervals. While the indicator is time-agnostic in design, it works within the natural time progression of the chart, ensuring that segmentation aligns with the inherent structure of price movement. Broken levels, where price has breached a structural boundary, and Unbroken levels, which remain intact, are visualized with horizontal lines. These structural zones are complemented by dynamically boxed segments that contextualize both historical and ongoing price behavior.
By offering an objective perspective, the Non-Psychological Levels indicator complements psychology-based tools, helping traders explore market dynamics from multiple angles. When structural levels align with psychological zones, they reinforce critical price areas; when they differ, they provide opportunities to analyze price behavior from an alternative lens. This indicator is designed as both an educational framework and a practical tool, encouraging a deeper understanding of structural price behavior in technical analysis.
⭕ THEORY AND CONCEPT ⭕
The Non-Psychological Levels indicator is grounded in the principle of analyzing price behavior without reliance on psychological assumptions or time-based factors. Its primary purpose is to provide a structural framework for identifying support and resistance levels by focusing solely on price movement within mechanically defined segments. By removing external influences such as sentiment, time intervals, or market sessions, the indicator offers an unbiased lens through which traders can observe price dynamics.
Non-psychology, as defined here, refers to an approach that excludes behavioral and emotional patterns—like fear, greed, or herd mentality—from price analysis. Traditional tools often depend on these patterns to identify zones such as pivots or Fibonacci retracements, but these methods can be inconsistent in volatile markets. In contrast, the Non-Psychological Levels indicator focuses entirely on what price is doing, free from assumptions about trader behavior or external time constraints.
The indicator’s time-agnostic and mechanically driven design segments price action into consistent ranges, highlighting "Broken" levels (where price breaches structural boundaries) and "Unbroken" levels (where price holds). These structural zones remain unaffected by subjective or external influences, ensuring clarity and consistency across different markets and timeframes. By doing so, the indicator reveals a pure view of price structure, independent of psychological biases.
Importantly, the Non-Psychological Levels indicator is not intended to replace psychology-based tools but to complement them. When its structural levels align with psychological zones like round numbers or session highs/lows, the significance of these areas is reinforced. Conversely, when the levels differ, the contrast provides traders with alternative insights into market dynamics. This dual perspective—blending mechanical objectivity with behavioral analysis—enhances the depth and flexibility of market evaluation.
The following principles outline the theoretical foundation of the indicator and its unique contribution to structural price analysis:
Time-Agnostic Design : The indicator avoids reliance on time-based factors like daily opens, session intervals, or specific events. Instead, it segments price action using bar indexes, ensuring that structural levels are identified independently of external time variables. While the x-axis of a chart inherently represents time, this indicator abstracts away its influence, allowing traders to focus purely on price movement without the bias of temporal context.
Mechanical and Neutral Framework : Every calculation within the indicator is predetermined by a set of mechanical rules, ensuring no subjective input or interpretation affects the results. This objectivity guarantees that levels are derived solely from observed price behavior, providing a reliable framework that traders can trust to remain consistent across different assets, timeframes, and market conditions.
Broken and Unbroken Levels : Broken levels represent zones where price has breached a structural boundary, while Unbroken levels highlight areas where price has consistently respected its range. This distinction provides a clear and systematic method for identifying key support and resistance levels, offering insights into where future price interactions are most likely to occur.
Neutral Price Behavior : By dividing price action into equal segments, the indicator removes the influence of external factors like trader sentiment or psychological expectations. Each segment independently determines significant levels based purely on price action, enabling a structural view of the market that abstracts away behavioral or emotional biases.
Complement to Psychological Tools : While the indicator itself avoids behavioral assumptions, its levels can align with psychological zones like round numbers, pivots, or Fibonacci levels. When these structural and psychological levels overlap, it reinforces the importance of key areas, while divergences offer opportunities to examine price behavior from a new perspective.
Educational Value : The indicator encourages traders to explore the contrast between structural and psychological analysis. By introducing a framework that isolates price behavior from external influences, it challenges traditional methods of technical analysis, fostering deeper insights into market structure and behavior.
🔍 UNDERSTANDING STRUCTURAL LEVELS 🔍
The Non-Psychological Levels indicator offers a straightforward yet powerful way to understand market structure by segmenting price action into mechanically defined ranges. This segmentation highlights two key elements: "Broken" levels, where price has breached structural boundaries, and "Unbroken" levels, which remain intact and respected by price action. Together, these components create a framework for identifying potential areas of support and resistance.
Broken Levels : These are structural boundaries that price has surpassed, indicating areas where previous support or resistance failed. Broken levels often signal transitions in price behavior, such as shifts in momentum or the start of trending movements. They provide insight into zones where price has already tested and moved beyond.
Unbroken Levels : These levels remain intact within a given price segment, marking areas where price has consistently respected boundaries. Unbroken levels are particularly useful for identifying potential reversal points or zones of continued support or resistance. Their persistence across price action often makes them reliable indicators of market structure.
The visual segmentation of price action into distinct ranges allows traders to observe how price transitions between structural zones. For example:
- Clusters of Unbroken levels near the current price may suggest strong support or resistance, offering areas of interest for reversals or breakouts.
- Gaps between Unbroken levels highlight areas of price inefficiency or low interaction, which may become significant if revisited.
By focusing solely on structural price behavior, the Non-Psychological Levels indicator enables traders to analyze price independently of time or psychological factors. This makes it a valuable tool for understanding price dynamics objectively, whether used on its own or alongside other indicators.
🛠️ SETTINGS 🛠️
The Non-Psychological Levels indicator offers various customizable settings to help users tailor its visualization to their specific trading style and market conditions. These settings allow adjustments to sensitivity, level projection, and the source of price calculations (e.g., wicks or closing prices). Below, we outline each setting and its impact on the chart, along with examples to illustrate their functionality.
Custom Settings
Sensitivity : This setting adjusts the balance between detailed and broader structural levels by controlling the number of segments. Higher values result in more segments, revealing finer price levels, while lower values consolidate segments to highlight major price movements.
Source : Allows the user to choose between 'Wick' or 'Close' for detecting levels. Selecting 'Wick' emphasizes the absolute highs and lows of price action, while 'Close' focuses on closing prices within each segment.
Level Labels : Configures the visual representation of price levels, allowing users to toggle between price values, symbols (▲ ▼), or disabling labels altogether. This setting ensures clarity in how Broken and Unbroken levels are displayed on the chart.
Unbroken Levels : - - - Users can customize the colors and label styles for Unbroken levels, which highlight areas where price has respected structural boundaries.
Broken Levels : -|- Similar to Unbroken levels, users can specify the visual appearance of Broken levels, including color customization for Broken highs and lows. These settings help distinguish areas where price has breached a structural boundary.
Projection Options : This setting allows users to control how broken and unbroken levels are visually extended on the chart. The Future option projects lines forward to the right of the current price, showing potential future relevance of levels. The All option extends lines both forward and backward, providing a comprehensive view of how levels align with historical and potential future price action. The None option disables projections, keeping the chart focused solely on current segment levels without any extensions.
Segments : Includes options for customizing the segment visualization:
- Live Segment : Toggles the display of a highlighted box representing the current developing segment, helping users focus on ongoing price action.
- Boxes : Allows users to display filled boxes around each segment for additional visual emphasis.
- Segment Colors : Users can define separate colors for support (lower) and resistance (upper) segments, making it easier to interpret directional trends.
- Boundaries : Enables or disables vertical lines to mark segment boundaries, providing a clearer view of structural divisions.
Repaint : This setting allows users to enable or disable triangle labels within the live segment. When enabled, the triangles dynamically update to reflect real-time price behavior during the live bar but will repaint until the bar is fully confirmed. Disabling this option prevents the triangles from appearing during the live bar, reducing potential confusion as they may otherwise flash on and off during price updates. This setting ensures users can choose their preferred visualization while maintaining clarity in real-time analysis.
Color Settings : Offers extensive customization for all visual elements, including Broken and Unbroken levels, segment boundaries, and live segments. These settings ensure the indicator can adapt to individual preferences for chart readability.
🖼️ CHART EXAMPLES 🖼️
The following chart examples illustrate different configurations and features of the Non-Psychological Levels indicator. These examples highlight how the indicator’s settings influence the visualization of structural price behavior, helping traders understand its functionality in various scenarios.
Broken and Unbroken Levels : Orange prices are Broken HIghs. Blue prices are Broken Lows. Green and Red are Unbroken.
Boundaries : Enable Boundaries to visualize segments.
High Sensitivity Setting : A high sensitivity setting produces fewer segments and levels, emphasizing broader price ranges and major structural zones. This configuration is better suited for higher timeframes or identifying overarching trends.
Low Sensitivity Setting : A low sensitivity setting results in a greater number of segments and levels, offering a granular view of price structure. This configuration is ideal for analyzing detailed price movements on lower timeframes.
Live Segment with Triangles Enabled : This example shows the live segment box with triangle labels enabled. These triangles update dynamically during the live bar but may repaint until the bar is confirmed, helping traders observe real-time price behavior.
Broken and Unbroken Levels : This example highlights Broken levels (where price has breached structural boundaries and are drawn through subsequent price action) and Unbroken levels (where price has respected structural boundaries). These distinctions visually identify areas of potential support and resistance.
Broken and Unbroken Levels with Projection: All : This example demonstrates the "Project All" feature, where broken and unbroken levels are extended both forward and backward on the chart. This visualization highlights historical and potential future support and resistance zones, helping traders better understand how price interacts with these structural levels over time.
Segment Boxes with Boundaries : Filled boxes around individual segments visually distinguish each price interval, offering clarity in observing structural price transitions.
📊 SUMMARY 📊
The Non-Psychological Levels indicator provides a unique framework for analyzing structural price behavior through the identification of Broken and Unbroken levels. These levels act as a mechanical representation of support and resistance, independent of psychological biases or time-based factors. By focusing purely on price movement within defined segments, the indicator offers a neutral and consistent approach to understanding market dynamics.
This method complements traditional tools by providing an unbiased perspective. When structural levels align with psychological zones—such as round numbers or session-based highs and lows—they reinforce the significance of these areas as key price zones. When they diverge, the indicator introduces an alternative view, prompting further exploration of price behavior. This dual perspective enhances the depth of analysis by combining the mechanical and behavioral aspects of price action.
The Non-Psychological Levels indicator is not designed to generate trading signals or predict future price movements but serves as a visual and educational tool. Its adaptability across all markets and timeframes allows traders to integrate it into their broader strategies. By highlighting structural price dynamics, the indicator offers a fresh perspective on market analysis while remaining compatible with other technical tools.
⚙️ COMPATIBILITY AND LIMITATIONS ⚙️
Asset Compatibility :
The Non-Psychological Levels indicator is compatible with all asset classes, including cryptocurrencies, forex, stocks, and commodities. It can be applied to any chart or timeframe, making it a flexible tool for structural price analysis. Users should adjust the Sensitivity setting to ensure the segmentation aligns with the price behavior of the specific asset being analyzed. For instance, higher sensitivity values are more suitable for assets with large price ranges, while lower values work well for assets with tighter ranges.
Visual Range Dependency :
The indicator is optimized to perform calculations only within the visible range of the chart. This is a significant advantage, as it prevents unnecessary calculations and maintains efficient performance. However, because of this dependency, levels may appear to "recalculate" when the chart is zoomed in or out quickly or shifted abruptly. While this does not affect the integrity of the levels, it may cause a temporary lag as the indicator adjusts to the new visual range.
Persistence of Levels Beyond Visibility :
Even if levels are not visible on the chart due to zoom or scroll settings, they still exist in the background and are recalculated when revisited. This ensures that the structural price analysis remains consistent, regardless of the chart view.
Box Limitations in Pine Script :
The indicator is subject to Pine Script's inherent limitation of 500 boxes. This means that no more than 500 segments or level boxes can be drawn on the chart simultaneously. For most configurations, this limitation is mitigated by focusing on the visual range, but users employing very low sensitivity settings may exceed the limit. In such cases, only the most recent 500 boxes will be displayed, potentially omitting earlier segments.
Lag with Low Sensitivity Settings :
When sensitivity is set to a low value, the indicator creates many more segments, resulting in finer granularity and a higher number of boxes. While this provides detailed structural levels, it may increase the likelihood of exceeding Pine Script’s 500-box limit or cause a temporary lag when rendering a dense set of boxes over a wide visual range. Users should adjust sensitivity to balance detail with performance, especially on assets with high volatility or broad price ranges.
Live Segment Caution :
The live segment box updates in real time to reflect price movements as the segment is still developing. Since the segment high and segment low are not yet finalized, users should interpret this feature as a dynamic visualization of current price behavior rather than a definitive structural analysis. This ensures clarity during ongoing price action while maintaining the integrity of the indicator's framework.
Cross-Market Versatility :
The indicator’s time-agnostic and mechanical design ensures that it functions identically across all markets and timeframes. However, users should consider the unique characteristics of different markets when interpreting the results, as certain assets (e.g., highly volatile cryptocurrencies) may require sensitivity adjustments for optimal segmentation.
Visual Range Dependency: Levels recalculate efficiently within the chart's visible range but may lag temporarily when zooming or scrolling quickly.
These considerations ensure that the Non-Psychological Levels indicator remains robust and versatile while highlighting some inherent limitations of Pine Script and real-time recalculations. Users can mitigate these constraints by carefully adjusting sensitivity and understanding how the visual range dependency affects performance.
⚠️ DISCLAIMER ⚠️
The Non-Psychological Levels indicator is a visual analysis tool and is not designed as a predictive or trading signal indicator. Its primary purpose is to highlight structural price levels, providing an objective framework for understanding support and resistance within mechanically segmented price action.
The indicator operates within the visible range of the chart to ensure efficiency and adaptiveness, but this recalculation should not be interpreted as a forecast of future price behavior. While the structural levels may align with significant price zones in hindsight, they are purely a reflection of observed price dynamics and should not be used as standalone trading signals.
This indicator is intended as an educational and visual aid to complement other analysis methods. Users are encouraged to integrate it into a broader trading strategy and make adjustments to the settings based on their individual needs and market conditions.
🧠 BEYOND THE CODE 🧠
The Non-Psychological Levels indicator, like other xxattaxx indicators , is designed with education and community collaboration in mind. Its open-source nature encourages exploration, experimentation, and the development of new approaches to price analysis. By focusing on structural price behavior rather than psychological or time-based factors, this indicator introduces a fresh perspective for users to study.
Beyond its visual utility, the indicator serves as an educational framework for understanding the concept of non-psychological analysis. It offers traders an opportunity to explore price dynamics in a purely mechanical way, challenging conventional methods and fostering deeper insights into structural behavior. This approach is especially valuable for those interested in exploring new concepts or seeking alternative perspectives on market analysis.
Your comments, suggestions, and discussions are invaluable in shaping the future of this project. We actively encourage your feedback and contributions, which will directly help us refine and improve the Non-Psychological Levels indicator. We look forward to seeing the creative ways in which you use and enhance this tool. MVS

Ultra High/LowThe Ultra High/Low script helps traders track key price levels by automatically marking significant highs and lows on a chart, highlighting potential reversal points for future trading decisions.
Introduction
The Ultra High/Low script identifies and marks significant highs and lows on a trading chart. These are specific points where the price reached a peak or bottomed out before reversing. The script draws lines at these levels, which can be extended, and it also labels the exact price at these points. This makes it easy for traders to see where the price has changed direction previously, helping them make more informed trading decisions.
Detailed Description
In more detail, the Ultra High/Low script is designed using Pine Script™, a programming language used for creating custom indicators and strategies on the TradingView platform. Here's how it works:
..........
Detection of Pivot Highs and Lows
The script identifies "pivot highs" and "pivot lows." These are points on the chart where the price reached a local maximum or minimum, surrounded by lower highs (for pivot highs) or higher lows (for pivot lows).
The user can customize how many bars to the left and right of the high or low the script should consider to confirm a pivot (Length argument in the settings).
The script uses Pine Script functions for pivot detection. ta.pivothigh() and ta.pivotlow() .
......
Drawing Lines and Labels
Once a pivot is identified, the script draws a dashed line from the pivot point to the current price bar. This line helps visualize where significant price reversals have occurred.
The script also adds a label next to these lines showing the exact price of the pivot point. This label also shows "PDH" (Previous Day High) or "PDL" (Previous Day Low) if the pivot is PDH or PDL. Same for "PWH" (Previous Week High) and "PWL" (Previous Week Low).
......
Purging and Extending Lines
If the price crosses a pivot line after it has been drawn, the script can either delete the old line (purged line) or keep it and add additional indicators to show that the line has been liquidated.
The script also has options to extend the lines into the right.
......
Custom Inputs
The script offers several customizable options, like the color of the lines and labels, whether to show the exact price or not, and whether to extend the lines. This allows traders to tailor the indicator to their specific needs and preferences.
..........
Overall, the Ultra High/Low script is a powerful visual aid for identifying critical price levels that may influence future price movements, making it easier for traders to make decisions based on historical price behavior.

MarketRangerThis indicator puts a selection of elements together providing traders with insights into price dynamics, trend changes, and potential trading opportunities within the specified timeframe.
Trading Range Defined by Support and Resistance :
Support and resistance levels are calculated using the lowest low and highest high over specified periods.
These
levels define the boundaries of the trading range within which the price moves.
WMA Color Changing based on Slope :
The script uses three Weighted Moving Averages (WMAs) with different lengths.
The color of the main WMA changes based on its slope.
When the slope of the WMA is positive (indicating an uptrend), it's displayed in blue. When it's
negative (indicating a downtrend), it's displayed in pink.
New High/Low Detection :
The script detects new highs and lows in the price action.
A new high is detected when the current high crosses under the previous resistance level, and a new low is detected when the current low crosses over the previous support level.
These
detections are marked by triangle shapes above or below the bars.
WMA Crosses :
The script calculates the difference between the two WMAs.
When the faster WMA crosses above the slower WMA, indicating a potential bullish signal, a blue cross shape is plotted below the bar.
When the faster WMA crosses below the slower WMA, indicating a potential bearish signal, a
pink cross shape is plotted above the bar.
Slope Changes :
The script calculates the slope of the main WMA and tracks changes in slope.
A positive slope indicates an upward trend, while a negative slope indicates a downward trend.
Slope changes from negative to positive indicate potential bullish momentum, and from
positive to negative indicate potential bearish momentum.
Customizable Pivot Levels :
Pivot levels are calculated based on user-defined percentages of the range between support and resistance.
Pivot Level 1 and Pivot Level 2 provide additional reference points for potential reversals or trend continuation.
Usage :
The indicator provides support and resistance levels, new high/low alerts, and WMA crosses.
The midpoint and customizable pivot levels offer potential trading zones.
Slope change points indicate potential shifts in market sentiment.
Customize the pivot levels according to your trading strategy.
Parameters :
Adjust the WMA lengths and support/resistance lengths to suit your trading style.
Modify the visibility settings to control how many periods of support and resistance are displayed.
Customize the pivot levels to fit your preferred trading strategy.
Alerts :
Alerts are triggered for new high/low points and WMA crosses.
Use alerts to stay informed about potential trading opportunities.
Interpretation :
Watch for new high/low points for potential trend reversals or continuations.
Monitor WMA crosses and slope changes for signals of market direction.
Consider trading near support/resistance levels and pivot points.
Additional Notes :
Experiment with different settings to find the configuration that best suits your trading preferences.
Backtest the indicator on historical data to validate its effectiveness before using it in live trading.
ML - Momentum Index (Pivots)Building upon the innovative foundations laid by Zeiierman's Machine Learning Momentum Index (MLMI), this variation introduces a series of refinements and new features aimed at bolstering the model's predictive accuracy and responsiveness. Licensed under the Creative Commons Attribution-NonCommercial-ShareAlike 4.0 International License (CC BY-NC-SA 4.0), my adaptation seeks to enhance the original by offering a more nuanced approach to momentum-based trading.
Key Features :
Pivot-Based Analysis: Shifting focus from trend crosses to pivot points, this version employs pivot bars to offer a distinct perspective on market momentum, aiding in the identification of critical reversal points.
Extended Parameter Set: By integrating additional parameters for making predictions, the model gains improved adaptability, allowing for finer tuning to match market conditions.
Dataset Size Limitation: To ensure efficiency and mitigate the risk of calculation timeouts, a cap on the dataset size has been implemented, balancing between comprehensive historical analysis and computational agility.
Enhanced Price Source Flexibility: Users can select between closing prices or (suggested) OHLC4 as the basis for calculations, tailoring the indicator to different analysis preferences and strategies.
This adaptation not only inherits the robust framework of the original MLMI but also introduces innovations to enhance its utility in diverse trading scenarios. Whether you're looking to refine your short-term trading tactics or seeking stable indicators for long-term strategies, the ML - Momentum Index (Pivots) offers a versatile tool to navigate the complexities of the market.
For a deeper understanding of the modifications and to leverage the full potential of this indicator, users are encouraged to explore the tooltips and documentation provided within the script.
The Momentum Indicator calculations have been transitioned to the MLMomentumIndex library, simplifying the process of integration. Users can now seamlessly incorporate the momentumIndexPivots function into their scripts to conduct detailed momentum analysis with ease.

Trend Channels [Cryptoverse]This Indicator dynamically generates and displays on the chart Trend Channels with the pivot points it determines in each market and in each time period. The type of price used to determine the pivot points and create the channels is optional (e.g. close or high, low).
It will help you identify your entry points and stop zones and help you take positions, but it does not contain any buy and sell signals or trading strategies. It creates more successful channels on higher timeframes.
Usage Settings:
---------------------------------------------------
General Settings:
Pivot Period: This field determines how many candles before and after a candle will be counted as a peak or bottom in order to determine the peaks and troughs on the chart.
Trend Channels are created by calculating the Pivot points according to the period set here. (Default value: 6)
Top Pivot Source: Determines which value of the related candle the top pivot points will be based on.
Bottom Pivot Source: Determines which value of the related candle the lower pivot points will be based on.
(Default: closing)
Trend Channels Settings:
Show All Trend Lines: Allows you to show or hide trend channels.
Hide Old Trend Lines: If you activate it, it allows you to hide the channels created in the past other than the current trend channels.
Hide 0.5 Lines: Allows you to hide lines at the Fibonacci 0.5 level.
Hide 0.236 Lines: Allows to hide lines at Fibonacci 0.236 level.
Hide 0.786 Lines: Allows to hide lines at Fibonacci 0.786 level.
Helper Line Format: Allows the helper line that converts a trend line into a channel to be drawn based on percentage or price.
*Note:* When using large time intervals by choosing percentages, there may be situations where the helper lines do not provide full parallels.
Up Trend Color: Indicates the outer color of the Up Trend channel.
Down Trend Color: Indicates the outer color of the Descending Trend channel.
0.5 Trend Color: Specifies the color of the fibonacci 0.5 line drawn for all channels.
0.236 Trend Color: Specifies the color of the fibonacci 0.5 line drawn for all channels.
0.786 Trend Color: Sets the color of the fibonacci 0.5 line drawn for all channels.
Trend Channel Width: Determines the thickness of the channel lines.
Trend Channel Style: Determines the style of the channel lines.

YD_Divergence_RSI+CMFThe ‘YD_Divergence_RSI+CMF’ indicator can find divergence using RSI (Relative Strength Index) and CMF (Chaikin Money Flow) indicators.
📌 Key functions
1. Search pivot high and pivot low points in a certain length of price.
2. Connect pivot high to pivot high , pivot low to pivot low , forming two standards for divergence in result.
The marker then plots only the higher high, lower low lines.
(higher low and lower high in prices are referred to hidden divergence, which are not considered in this indicator)
3. Compare the two standards with RSI and CMF indicators, send an alert if there is a divergence. As a result, the indicator will find four combination of divergence.
A. Higher high price / Lower RSI (Bearish RSI Divergence)
B. Lower low price / Higher RSI (Bullish RSI Divergence)
C. Higher high price / Lower CMF (Bearish CMF Divergence)
D. Lower low price / Higher CMF (Bullish CMF Divergence)
📌 Details
Developing the indicators, we put a lot of effort in making a customizable and user-friendly interface.
#1. Pivot Setting
Users can set the length to find the pivot high / pivot low in ‘Pivot Settings – Pivot Length.’
Increased pivot Length takes more candles to interpret the chart but reduce false signals since the it uses only the most certain pivot high / pivot low values. Obviously, decreased pivot length will act the opposite.
Users can choose whether to use ‘High/Low’ or ‘Close’ in ‘Pivot Reference’ to set the swing point of prices.
Users can also choose whether to display the pivot high / pivot low marker on the chart.
#2 RSI & CMF Settings
Users can adjust the length of RSI & CMF separately. (The default values are set to 14 and 20 each.)
#3 Label Setting
Users can adjust the text displayed on the chart label. (The default values is set to ‘Bullish / Bearish’, ‘RSI/CMF’, ‘Divergence’.)
Users can reduce the length of text label or simply turn the label off. Just click the ‘Bull/Bear’ or ‘None’ button. ‘Divergence’ works the same.
Users can decide whether to display the ‘Divergence Line and Label’, set custom settings for the label and line. (color, thickness, style, etc)
📌 Alert
Alert are provided as a combination of the chart's symbol and the set label text. For example,
‘BINANCE:BTCUSDT.P, Bullish RSI Divergence’
====================================================
"YD_Divergence_RSI+CMF" 지표 는 RSI와 CMF 지표를 이용해서 Divergence 를 찾아낼 수 있습니다.
📌 주요 기능
1. 정해진 가격 움직임 안에서 pivot high와 pivot low 포인트 를 찾아냅니다.
2. Pivot high로만 이어진 라인과, Pivot low로만 이어진 두 라인을 작도한 뒤 divergence의 기준으로 삼습니다.
이 지표에서는 normal divergence만 사용하기 때문에 차트에 higher high와 lower low만 표기 합니다.
(higher low와 lower high는 hidden divergence로 정의되며, 이 지표에서는 다루지 않습니다.
3. 두 기준선과 RSI, CMF 지표를 각각 비교하고, 결과적으로 4개의 조합을 구할 수 있습니다.
A. Higher high price / Lower RSI (Bearish RSI Divergence)
B. Lower low price / Higher RSI (Bullish RSI Divergence)
C. Higher high price / Lower CMF (Bearish CMF Divergence)
D. Lower low price / Higher CMF (Bullish CMF Divergence)
📌 세부 사항
지표를 개발하며 사용자들이 원하는 방향으로 지표를 설정할 수 있게 작업에 많은 공을 들였습니다. 굉장히 다양한 옵션을 선택할 수 있으며, 원하는 방식으로 지표를 사용할 수 있습니다.
#1 Pivot Setting
Pivot setting에서는 Pivot Length를 변경할 수 있습니다.
Pivot Length를 늘릴 경우, 보다 확실한 Swing High와 Swing Low만을 사용하게 되므로, False signal이 줄어들 수 있습니다. 하지만 Swing High/ Low를 판정하는 데에 더 긴 시간이 걸리게 되므로, Signal이 다소 늦게 발생하는 단점이 생기게 됩니다.
Pivot Length를 줄일 경우, 반대로 Swing High/Low의 판정이 더 빨리 일어나기 때문에, Signal을 거래에 이용하기는 좋을 수 있습니다. 다만, Swing High와 Low가 훨씬 더 잦은 빈도로 발생하기 때문에 False Signal을 줄 가능성이 높아집니다.
Pivot Reference에서는 가격의 Swing Point를 설정함에 있어, High/Low(고가/저가)를 이용할 지 Close (종가)를 이용할 지 선택할 수 있습니다.
Pivot High/Low Marker를 선택할 경우 Pivot High/ Low에 Marker가 찍히게 됩니다.
#2 RSI와 CMF Setting
RSI와 CMF Setting에서는 RSI와 CMF의 길이를 각각 설정할 수 있습니다. 기본값은 14와 20으로 설정되어 있습니다.
#3 Label Setting
Label Setting에서는 Label에 표시되는 글자를 선택할 수 있습니다.
기본값은 "Bullish / Bearish", "RSI/CMF", "Divergence"로 선택되어 있으며, 너무 길다고 느껴질 경우 "Bull/Bear" 혹은 "None"을 클릭하여 길이를 줄일 수 있습니다. 마찬가지로 Divergence의 경우도 생략이 가능합니다.
하단에서는 Divergence Line과 Label을 켜고 끌 수 있으며, 선의 색깔, 굵기, 종류, 그리고 Label의 색깔, 크기, 종류를 선택할 수 있습니다. Label의 Text 색 역시 변경이 가능합니다.
📌 얼러트
얼러트는 자신이 설정한 차트의 심볼과 Label의 문구의 조합으로 제공되며 예를 들면 다음과 같습니다.
"BINANCE:BTCUSDT.P, Bullish RSI Divergence"

Dual Dynamic Fibonacci Retracement — Long and Short Duration
Title : "The Dual-Dynamic Fibonacci Retracement Script: An Advanced Tool for Comprehensive Market Analysis"
As the author of the "Dual-Dynamic Fibonacci Retracement Script", I am delighted to introduce you to this cutting-edge tool for technical analysis. Unlike conventional Fibonacci scripts, this advanced model incorporates multiple unique features and adjustments that make it a powerful asset for any market analyst. Whether you're dealing with forex, commodities, equities or any other market, this script is versatile enough to enhance your trading strategy.
Uniqueness & Differentiation:
The "Dual-Dynamic Fibonacci Script" stands out by offering two distinct lookback periods. This feature is what separates it from other scripts available in the market. The first lookback period is longer, focusing on capturing broader market trends. The second lookback period is shorter, allowing for a more granular analysis of near-term market fluctuations. This dual perspective provides a more comprehensive view of the market, allowing you to see both the forest and the trees at the same time.
Fibonacci Levels:
While offering the standard Fibonacci retracement levels (0.236, 0.382, 0.5, 0.618, 0.786, and 1.0), the script also gives you the ability to plot 0.114 and 0.886 levels. These additional levels offer an extra layer of depth to your analysis, and can prove crucial in high-volatility markets where they often serve as significant support and resistance points.
Customizable Line Shifts and Extends:
This script provides options for customization of the shift and extension of the plotted lines. This means you can adjust the start and end points of the Fibonacci lines according to your personal trading style and strategy. This level of personalization is not typically available in other scripts, and it allows for a more tailored visual representation.
Flexible Trading Positioning:
Depending on whether the closing price is above or below the midpoint of the pivot high and pivot low, the Fibonacci retracement levels are adjusted accordingly. This ensures the script remains relevant and useful regardless of market conditions.
Clean Visualization:
To prevent clutter and maintain focus on the most relevant price action, the script removes old Fibonacci lines and plots new ones once a new pivot high or low is identified. This clean visualization helps keep your analysis focused and sharp.
How to Use the Script:
To get started, simply adjust the lookback periods according to your trading strategy. If you're a long-term investor or prefer swing trading, a longer lookback period might be appropriate. Conversely, if you're a day trader, a shorter lookback period might be more beneficial.
The "Shift" and "Extend" inputs allow you to control the positioning of the Fibonacci lines on your chart. Positive values shift the lines to the right, while negative values shift them to the left.
You also have the choice to plot the additional Fibonacci levels (0.114 and 0.886) via the "Plot 0.114 and 0.886 levels?" input. Similarly, the "Plot second set of levels?" input lets you decide whether to display the second set of Fibonacci levels derived from the shorter lookback period.
Like any technical analysis tool, this script is most effective when used in conjunction with other indicators and methods of analysis. It is designed to work well in trending markets, where Fibonacci retracements can often indicate potential reversal levels. However, it's always recommended to use a holistic approach to market analysis to maximize the likelihood of successful trades.
Note: the two lines drawn on the chart are there to help the user identify the levels from which the two respective Fib sequences are calculated.
~~~
Input Explanations:
Long Period Pivot High/Low Lookback and Short Period Pivot High/Low Lookback : These settings determine the length of the lookback periods for the long-term and short-term pivot points, respectively. A pivot point is a technical analysis indicator used to determine the overall trend of the market over different time frames. The pivot points are then used to calculate the Fibonacci levels. A longer lookback period will identify pivot points over a broader time frame, capturing major market trends, while a shorter lookback period will identify pivot points over a narrower time frame, capturing more immediate market movements.
Long Period Fibonacci Level Shift and Short Period Fibonacci Level Shift : These inputs control the shift of the Fibonacci levels based on the long and short lookback periods, respectively. If you want to shift the Fibonacci levels to the right, increase the value. If you want to shift the Fibonacci levels to the left, decrease the value. This allows you to adjust the Fibonacci levels to better align with your analysis.
Long Period Fibonacci Level Extend and Short Period Fibonacci Level Extend : These inputs control the extension of the Fibonacci levels based on the long and short lookback periods, respectively. If you want the Fibonacci levels to extend further to the right, increase the value. If you want the Fibonacci levels to extend less to the right, decrease the value. This feature provides the flexibility to adjust the length of the Fibonacci levels according to your personal trading preferences and strategy.
Plot 0.114 and 0.886 levels? : This setting gives you the ability to plot the additional 0.114 and 0.886 Fibonacci levels. These levels provide extra depth to your analysis, particularly in highly volatile markets where they can act as significant support and resistance levels.
Plot second set of levels? : This input allows you to decide whether to plot the second set of Fibonacci levels based on the short lookback period. Displaying this second set of levels can provide a more granular view of market movements and potential reversal points, enhancing your overall analysis.

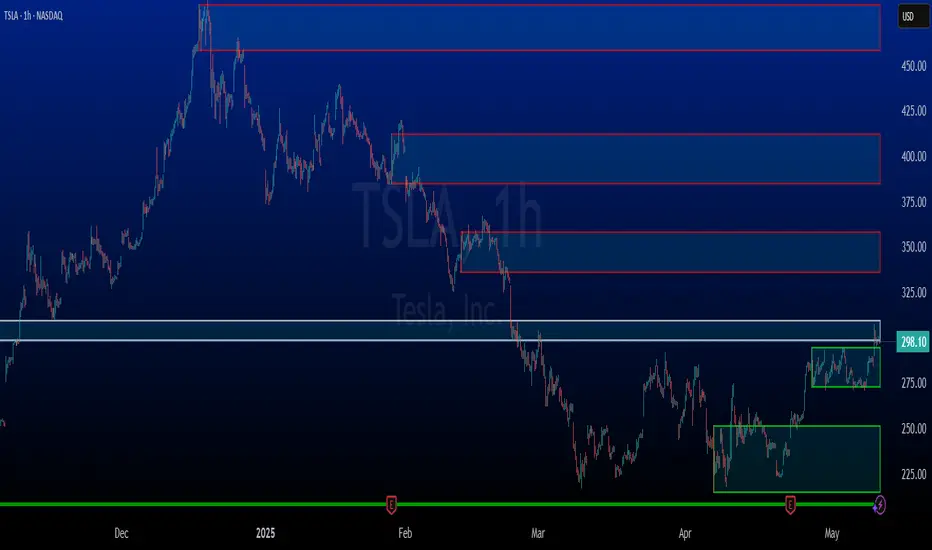
Supply and DemandThis is a "Supply and Demand" script designed to help traders spot potential levels of supply (resistance) and demand (support) in the market by identifying pivot points from past price action.
Differences from Other Scripts:
Unlike many pivot point scripts, this one offers a greater degree of customization and flexibility, allowing users to determine how many ranges of pivot points they wish to plot (up to 10), as well as the number of the most recent ranges to display.
Furthermore, it allows users to restrict the plotting of pivot points to specific timeframes (15 minutes, 30 minutes, 1 hour, 4 hours, and daily) using a toggle input. This is useful for traders who wish to focus on these popular trading timeframes.
This script also uses the color.new function for a more transparent plotting, which is not commonly used in many scripts.
How to Use:
The script provides two user inputs:
"Number of Ranges to Plot (1-10)": This determines how many 10-bar ranges of pivot points the script will calculate and potentially plot.
"Number of Last Ranges to Show (1-?)": This determines how many of the most recent ranges will be displayed on the chart.
"Limit to specific timeframes?": This is a toggle switch. When turned on, the script only plots pivot points if the current timeframe is one of the following: 15 minutes, 30 minutes, 1 hour, 4 hours, or daily.
The pivot points are plotted as circles on the chart, with pivot highs in red and pivot lows in green. The transparency level of these plots can be adjusted in the script.
Market and Conditions:
This script is versatile and can be used in any market, including Forex, commodities, indices, or cryptocurrencies. It's best used in trending markets where supply and demand levels are more likely to be respected. However, like all technical analysis tools, it's not foolproof and should be used in conjunction with other indicators and analysis techniques to confirm signals and manage risk.
A technical analyst, or technician, uses chart patterns and indicators to predict future price movements. The "Supply and Demand" script in question can be an invaluable tool for a technical analyst for the following reasons:
Identifying Support and Resistance Levels : The pivot points plotted by this script can act as potential levels of support and resistance. When the price of an asset approaches these pivot points, it might bounce back (in case of support) or retreat (in case of resistance). These levels can be used to set stop-loss and take-profit points.
Timeframe Analysis : The ability to limit the plotting of pivot points to specific timeframes is useful for multiple timeframe analysis. For instance, a trader might use a longer timeframe to determine the overall trend and a shorter one to decide the optimal entry and exit points.
Customization : The user inputs provided by the script allow a technician to customize the ranges of pivot points according to their unique trading strategy. They can choose the number of ranges to plot and the number of the most recent ranges to display on the chart.
Confirmation of Other Indicators : If a pivot point coincides with a signal from another indicator (for instance, a moving average crossover or a relative strength index (RSI) divergence), it could provide further confirmation of that signal, increasing the chances of a successful trade.
Transparency in Plots : The use of the color.new function allows for more transparent plotting. This feature can prevent the chart from becoming too cluttered when multiple ranges of pivot points are plotted, making it easier for the analyst to interpret the data.
In summary, this script can be used by a technical analyst to pinpoint potential trading opportunities, validate signals from other indicators, and customize the display of pivot points to suit their individual trading style and strategy. Always remember, however, that no single indicator should be used in isolation, and effective risk management strategies should always be employed.

Swing Levels and Liquidity - By LeviathanThis script will plot pivot points (swing highs and lows) in the form of lines, boxes or labels to help you identify market structure, “liquidity” areas, swing failure patterns, etc. You are also able to see the volume traded at each pivot point, which will help you compare their significance.
Bars Left-Right
A pivot high (swing high) is a bar in a series of bars that has a higher value than the bars around it and a pivot low (swing low) is a bar in a series of bars that has a lower value than the bars surrounding it. The Bars Left and Bars Right parameters are used to define the number of bars on the left and right sides of a pivot point that the function should consider when identifying pivot highs and lows in a time series. For example, if Bars Left is set to 5 and Bars Right is set to 6, the function will look for a pivot point by comparing the value of the current bar with the values of the 5 bars to its left and the 6 bars to its right. If the value of the current bar is higher than all of these bars, it is considered a pivot high point. These parameter can be used to adjust the sensitivity of the script (lowering the Bars Left and Bars Right parameters will give you more swing points and increasing the Bars Left and Bars Right parameters will give you fewer swing points).
”Show Boxes” - This will draw a box above the swing high and a box below the swing low to help you visualise a large area of interest around swing points. Additional box types and the width of the box can be adjusted in Appearance settings below.
”Show Lines” - This will draw a horizontal line at the level of each swing high and swing low.
”Show Labels” - This will plot a circle at the high point of each swing high and at the low point of each swing low.
”Show Volume” - This will display the amount of volume traded in a given swing point candle. It can help you identify the significance of a given swing point by comparing it to the volumes of other swing points.
”Extend Until Filled” - This will extend the swing point levels until they are mitigated by the price. Turning it off will continue plotting the levels just a few more bars after a swing point occurs.
”Appearance” - You can show/hide swing points, choose the colors of labels, lines and boxes, choose the size and positioning of the text, choose line and box appearance (adjust the Box Width when switching between timeframes!) and more.
More updates coming soon (MTF, more data…)

CryptoverseThis Indicator dynamically generates and charts Pivot Points, Support and Resistance Lines, Trend Channels and even Rsi Divergences in every market and every time period.
While it helps you identify your entry points, stop loss and take positions, it certainly does not include trading signals and trading strategy.
Bonus: the indicator contains ema21, ema50, ema100 and ema200 to support the lines created. If you wish, you can change the EMA values in the settings.
Recommendation: RSI is included in the indicator codes in order to detect divergences dataally, but it is not displayed on the chart. I recommend adding an additional RSI indicator to keep track of past and current potential divergences.
USER MANUAL:
----------------------------------------------
General Settings:
Pivot Period: This field determines how many candles before and after a candle should be controlled in order to be able to determine the top and bottom points on the chart.
Support and Resistance Lines and Trend Channels formed on the chart are created by calculating the Pivot points formed according to the period determined here. (Default value: 6)
Pivot Source: Determines the pivot points to be created according to the value of the relevant candle.
(Default and Recommended: closing)
----------------------------------------------
Support And Resistance Settings:
Custom Bars Back: This area allows you to specify how many pivot points from the current candle to the previous candle to create support resistance lines on the Chart. The default value is the last 500 candles.
*Note: The more old candles are checked, the more support and resistance lines will appear. This may prevent you from making sound determinations on the chart.*
Current Bar Decrease: This field works integrated with Custom Bars Back. By subtracting the current candle by the specified number, it provides the formation of lines without including those candles.
Default value: It is set to 0 to include current data.
Example: If Custom Bars Back: 500 and Current Bar Decrease: 10, Support and Resistance lines are created by considering 500 candles before the last 10 candles without including the last 10 candles on the chart.
Show S/R Lines: This field allows you to show or hide the Support and Resistance lines at any time.
Auto Simplification: This field is marked by default. It allows the Simplification Steps value to be determined automatically within the code according to the time period and current volatility of the relevant parity. (It is recommended to use the default version.)
Simplification Steps: This field allows you to get more understandable lines by simplifying the Support and Resistance lines based on Pivot points. If a simplification is not done, the lines to be formed with only the pivot points will be too many and this creates a dirty and useless appearance on the chart.
Each 1 digit you enter as a step combines the lines that are close to each other at a value of 0.01% and creates a common line.
Example: If you enter the number 10 as Steps, it will form a single common line from lines close together, starting at 0.01% respectively. It will continue to increase by 0.02%, 0.03%, 0.04% in its next steps. For the number 10, it will complete its loop by combining lines within the last remaining lines that are as close as 0.1% to each other and creating new lines from their midpoints.
The deafult value is 14. (Max. simplifies lines with closeness up to 1.4%.)
Important Note: If Auto Simplification is on, the entered value has no meaning. The Indicator performs simplification operations automatically. If you want to manage these steps manually, you can turn off Auto Simplification and enter your own value.
S/R Lines Color: Allows you to specify the color of the lines.
Label Location: Allows you to determine how many candles ahead the information label formed for each line will be positioned.
Line Label Descriptions:
Line: It is the price value that the line coincides with.*
Distance: Shows the percentage distance of the line from the current price.
▲ : Shows the percentage distance from the line above it.
▼ : Shows the percentage distance from the line below it.
Strength: Indicates the total number of steps the process has taken during the simplification process. The height of the number indicates the strength of resistance and support in the close price range.
C. Width: stands for Channel Width. It shows the percentage value between the highest price and the lowest price on the past candle as many candles specified by Custom Bars Back.
S. Steps: stands for Simplification Steps. Indicates the number of simplification steps applied. A value of 150 in the image indicates that a 1.5% simplification range has been applied.
----------------------------------------------
Trend Channels Settings:
Show All Trend Lines: Allows you to show and hide trend channels.
Hide Old Trend Lines: If you enable it, it will hide channels created in the past except for Current Trend channels.
Helper Line Format: Allows the auxiliary line that converts a trendline to a channel to be drawn based on percentage or price.
Note: There may be cases where the auxiliary lines do not provide full parallelism when using large time intervals by preferring a percentage.
Up Trend Color: Indicates the color of the Up Trend channel.
Down Trend Color: Specifies the color of the Downtrend channel.
Show Up Trend Overflow, Show Down Trend Overflow:
When the price closes above or below the trend channels, it provides awareness with the help of a text on the chart. Colors can be adjusted according to preference.
----------------------------------------------
RSI Divergences Settings:
This indicator gives you information about 4 different divergences. You can customize the divergence views with the show and hide options.
Bullish Regular, Bullish Hidden, Bearish Regular and Bearish Hidden.
Green divergences from the bottom of the graph represent bullish, and red divergences above the graph represent bearish.
Important note: Seeing a mismatch label definitely indicates that there is a mismatch between prices and rsi, but a mismatch does not always indicate a change in price.
Potential Divergence:
The indicator not only shows you past divergences, but also informs you of potential divergences based on the current status of the chart.
A potential divergence may not turn into a true one if the price flow continues to increase or decrease in the same direction. But all divergences seen in the past must have been shown as potential divergences beforehand.
Rsi Length, Rsi Source: Allows you to change settings for RSI values typically embedded within the indicator.
Note: Pivot Source and RSI Source using the same type of candle data ensures that divergences are displayed correctly.
----------------------------------------------
EMA Settings:
The indicator allows you to use 4 different EMA data in addition to Support and Resistance lines, Trend Channels and RSI divergences. By default, 21, 50, 100 and 200 are used. You can change the EMA values and colors in the Settings section, or you can use the show hide options in the Style section.

Divergence DetectorOverview:
- Identifies divergence on the specified indicator. Support for additional indicators in development.
- Divergence labels indicate strength of divergence, making it easy to spot stronger divergence.
- Fully customizable (including inputs for indicator type and length, pivot lengths, divergence type, lookback range, price source, and more), allowing you to see exactly what you want based on your chart type and timeframe.
Inputs:
See tooltips on Inputs page in settings.
Please report any issues/bugs, enhancement suggestions, or requests for additional indicator support.
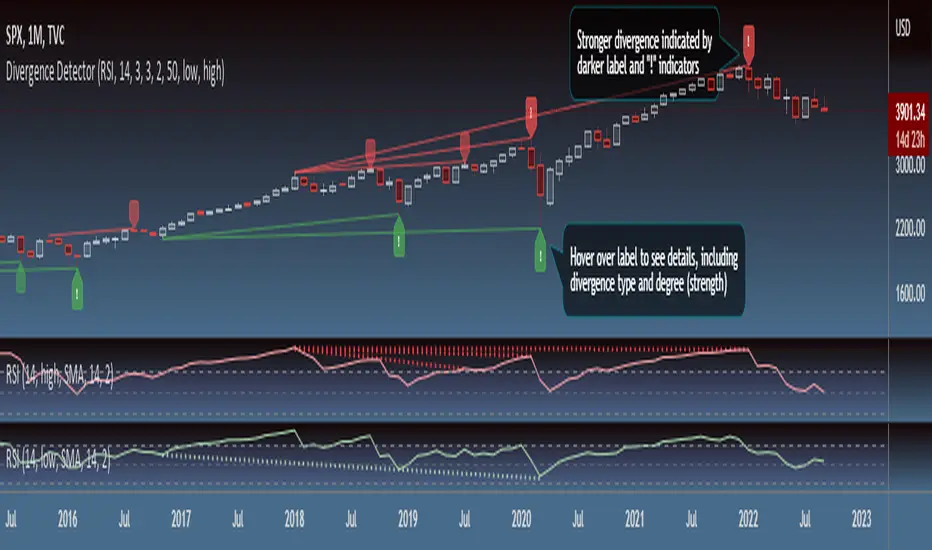
JxModi CamarillaAddition to the Camarilla Pivots, This script will allow user to Add 4+1 more Indicators -EMA-9/20/50/200 & VWAP .
As well EMA can be change.
All the Support(L) and Resistance(H) levels can be enabled / disabled from settings. It will allow to select multiple combinations of support(L) & Resistance(H) levels across levels at any of the Time-frames individually and combined.
All EMA & VWAP Indicators can be can be enabled / disabled from settings.
Camarilla pivots Support(L) & Resistance(H) levels Can be Changed for any of the Time frames.
NoBrain BreakoutUse 3min. Time frame.
Buy Stock Selection:-
When Close Price Cross Monthly Standard Pivot R1 & Monthly Standard Pivot R1 is Greater than Previous Day High( PDH ) Or Close.
Price must be Above 44 MA ,48 EMA & Vwap
***Buy When 3min Candle closed Above Camarilla R4 or Monthly Standard Pivot R1 whichever is High.
Sell Stock Selection:-
When Close Price Cross Monthly Standard Pivot S1 & Monthly Standard Pivot S1 is Less than Previous Day Low( PDL ) Or Close.
Price must be Below 44 MA ,48 EMA & Vwap
***Sell When 3min Candle closed Below Camarilla S4 or Monthly Standard Pivot S1 whichever is Low.
Trading time for
1st wave 9.30am to 10.45am.
2nd wave 12.45pm to 2.45pm.
(Based on NSE/ BSE India)
Indicators:-
1) Pivot Points Standard - Time Frame monthly.only select R1
2) Pivot Points Camarilla- Only select R4.
3) SMA 44
4) EMA 48
5) Vwap
6) For Trailing Stop Loss use SuperTrend- Length-13 Factor-2.7 or Length-15 Factor-3 (3min Timeframe)
MF 200 EMA PivotPointWe will be using the 200 EMA for identifying the trend of the market & possible cross overs for Swing trades. Pivot points will be really useful for defining the Supports & resistance. By combining with these two strategies we can understand the markets simple & clear. No need to fill your chart with Graphical designs.
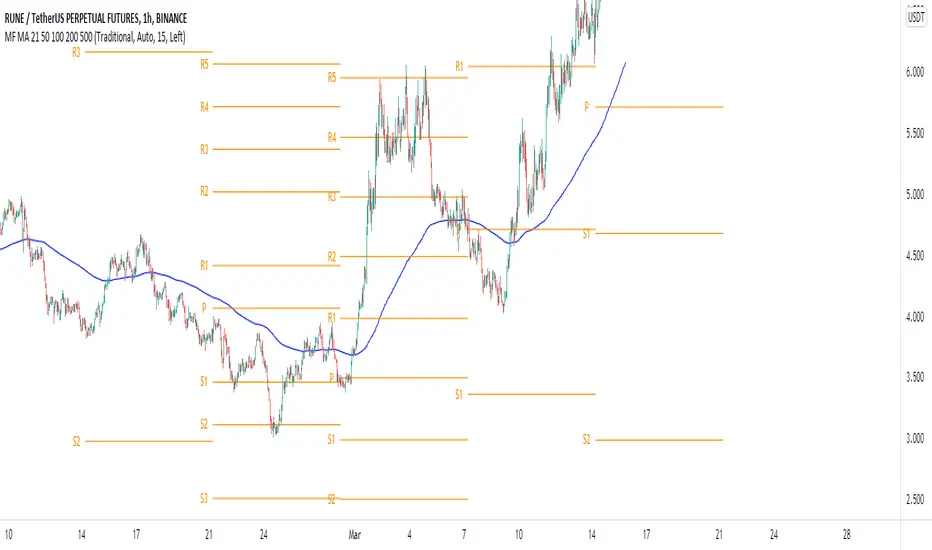
Nareshraju CPRHi friends this is Cpr indicator which means central pivot range. it contains supports and resistances to take perfect entry.
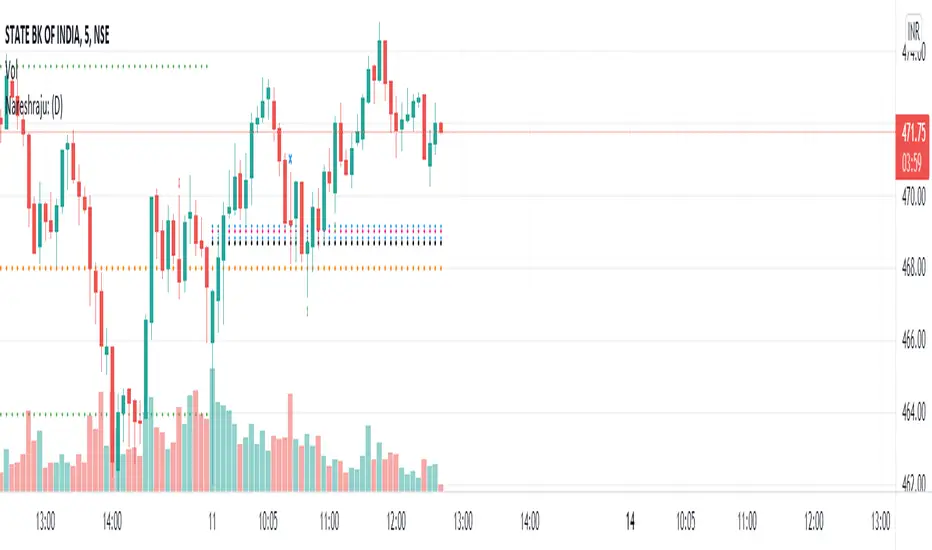
Developing Pivot Range [Swastik]This is the developing cpr indicator made by Swastik.
It shows how the cpr is developing as the day is progressing.
The colour of the range is red when tc is below bc and green when tc is above bc .
While calculating the value of cpr , the high is the high from starting of the session and low is the low from starting of the session till that specific candle.
This also shows that the trend is developing.
If the colour is red and the range starts widening, it means downtrend has started to develop and
when the colour is green and range starts widening, it means uptrend is developing.

FibFans on Previous HTF HL [FaizanNawaz] by DGTFibonacci Fans application on top of Previous Higher TimeFrame High and Low. Idea owner is @faizannawaz1, special thanks to him for both the idea and tesing the application
WARNING : Study includes plottings in the future, and due to temporal gaps in non 7/24 markets such as weekends, holidays etc plotting of the fans will move to the open session (the effect will be observed on Friday and Monday). With crypto no any side affect will be observed.
More about Fibonacci Fans, how to apply fibonacci fans and automated fibonacci speed and resistance fans study
Adiitonally the study includes some addons, such as
Central Pivot Range and Traditional Pivot Points
Volume Weighted Colored Bars
Price Range Meter - Horizontal HTF Candle
Disclaimer :
Trading success is all about following your trading strategy and the indicators should fit within your trading strategy, and not to be traded upon solely
The script is for informational and educational purposes only. Use of the script does not constitute professional and/or financial advice. You alone have the sole responsibility of evaluating the script output and risks associated with the use of the script. In exchange for using the script, you agree not to hold dgtrd TradingView user liable for any possible claim for damages arising from any decision you make based on use of the script